
Global Markets
Tradable Products

The Cboe S&P 500 Spot Volatility Index (SPOTVOL) provides a jump-robust, unbiased estimator of S&P 500 spot volatility. While the VIX® Index measures market implied volatility over the next 30 days, SPOTVOL focuses on measuring the market implied instantaneous volatility using short-dated, out-of-the-money SPX options.
For a detailed whitepaper on the calculation of SPOTVOL, please see the SPOTVOL Methodology.
The Cboe S&P 500 Left Tail Volatility Index (LTV) is designed to measure the expected (risk-neutral) return volatility associated with extreme negative moves in the S&P 500 Index. Specifically, the index estimates the volatility impact of a ten-standard deviation or larger downside move in the S&P 500 over a one-week horizon.
For a detailed whitepaper on the calculation of LTV, please see the LTV Methodology.
For streaming values, subscribe to Cboe Global Indices Feed
The Cboe Global Indices Feed is a market data service provided by Cboe Global Markets that delivers real-time index values on more than 1,500 products, including DSPX. Featured values from Cboe include SPX® and the VIX® as well as indices from Morningstar, Standard & Poor's/Dow Jones, FTSE Russell, Ameribor, CoinRoutes RealPrice, Gemini, MSCI, Societe Generale and others.
In response to the heightened focus on near-term S&P 500 trading, SPOTVOL and LTV were designed to provide a granular and dissected view into the risks present within the S&P 500 over the same time horizons. While SPOTVOL, LTV, and the suite of Cboe Volatility Indices all utilize SPX option pricing, SPOTVOL and LTV focus on and highlight specific portions of SPX volatility surface.
SPOTVOL applies a novel weighting scheme in order to mute the impact of jump risk while isolating the expectation of near-the-money diffusive component risk. When used in tandem with the VIX Index and its shorter duration analogs, investors can gain meaningful insight into the level of jump risk and short-term tail risk of the S&P 500.
In contrast, LTV calculates the probability of an extreme downside move (ten standard deviations) in the S&P 500 over short-term horizons. To measure this risk, LTV focuses on deep out-of-the-money puts, aiming to isolate the fair market price of crash risk insurance. Similarly to SPOTVOL, LTV can be viewed simultaneously to the suite of VIX Indices to offer more understanding of where the volatility risk premium within the S&P 500 is concentrated.
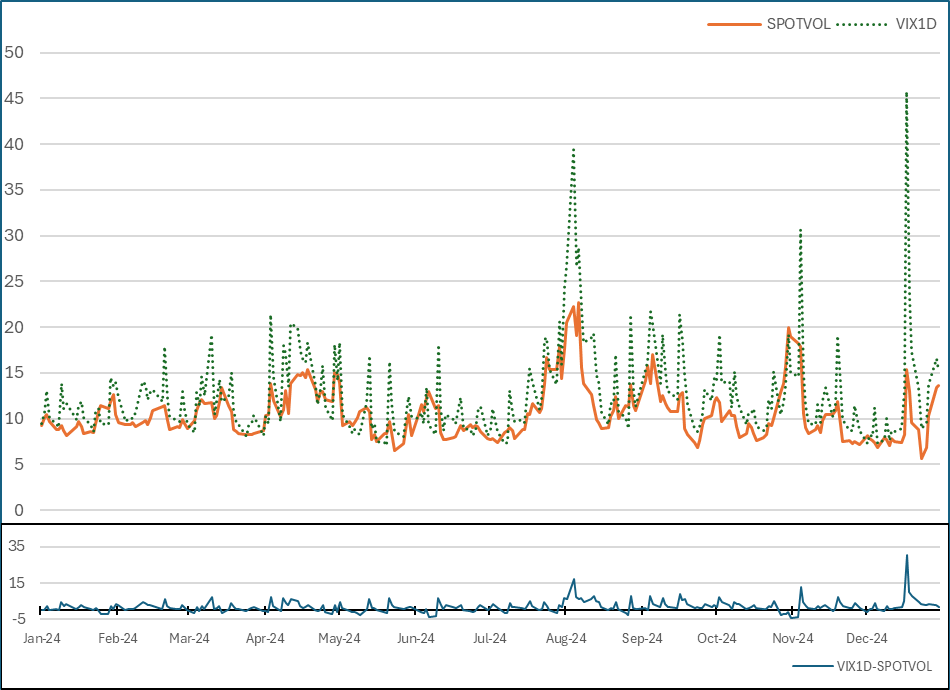
Shown below are historical end-of-day values of SPOTVOL and VIX1D throughout 2024, as well as the end-of-day spread between the two indices. While both indices appear to follow the same general path, there are notable exceptions that arise, particularly during times of market stress. Comparing the behavior of these two indices during the volatility events in August and December highlights how the addition of SPOTVOL helps compliment VIX1D, and how when used together, one can gain a quick understanding of where the bulk of volatility risk premium exists on the short-dated S&P 500 volatility surface.
While VIX1D spiked to similar highs in August and December, SPOTVOL reacted quite differently. With our understanding of how these two indices function, we can interpret this variation as a difference in localized reactions on the short-dated S&P 500 volatility surface. The event in August was a broader move seen across all of the option skew, while the December FOMC event showed a more sizable reaction in the wings, as opposed to the near-the-money options.
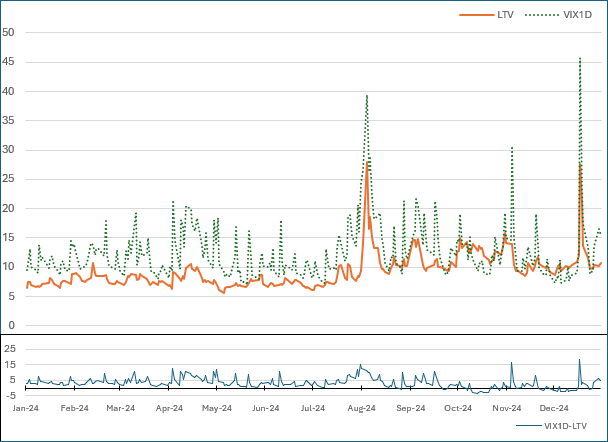
The same exercise is repeated using LTV and VIX1D. As expected from the prior interpretation of SPOTVOL vs VIX1D, the August volatility event was spread across deep out-of-the-money puts as well as near-the-money options. Additionally, we can see a sizable reaction in LTV during the December event, confirming our view that the majority of that move in volatility was concentrated in the wings.
For a concrete view into the development and meaning behind SPOTVOL and LTV, please see "Beyond the VIX: Model-Free Spot Volatility and Tail Indices from Short-dated Options"
Disclaimer: There are important risks associated with transacting in any of the Cboe Company products discussed here. Before engaging in any transactions in those products, it is important for market participants to carefully review the disclosures and disclaimers contained at: Disclosures and Disclaimers Related to Cboe Options and Futures Products. These products involve the risk of loss, which can be substantial and, depending on the type of product, can exceed the amount of money deposited in establishing the position. Market participants should put at risk only funds that they can afford to lose without affecting their lifestyle. © 2025 Cboe Exchange, Inc. All Rights Reserved.


