
Read More
Using more than 32 years of analysis, University of Illinois at Chicago Professor Oleg Bondarenko explored if certain strategies could exploit the richness in pricing of index options. He shared his findings in the recent white paper, “Historical Performance of Put-Writing Strategies” and discussed his research at the 35th annual Cboe Risk Management Conference. See what he has to say below.
Volatility Risk Premium (VRP) for S&P 500 Options
In his research, Bondarenko found that the S&P 500 Index implied volatility has considerably exceeded its realized volatility. From 1990 to 2018, the average implied volatility, as measured by the Cboe Volatility Index® (VIX®), was 19.3%, while the average realized volatility of the S&P 500® Index was 15.1%. The Volatility Risk Premium (VRP) was a significant difference of 4.2 percentage points.
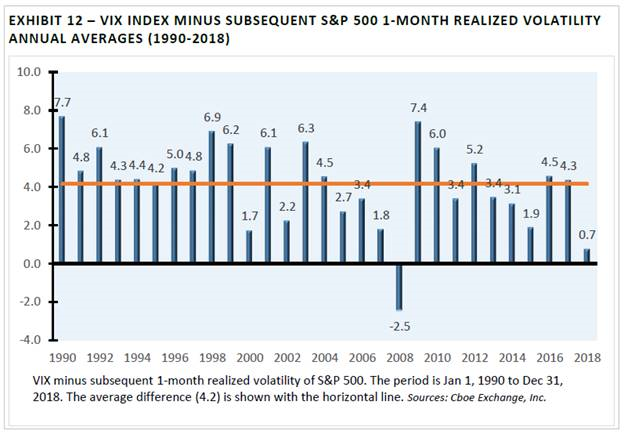
In light of the existence of the VRP, option-selling strategies may have had the potential to deliver superior risk-adjusted returns when compared to traditional asset classes and option-buying strategies.
Higher Risk-Adjusted Returns for PUT Index since Mid-1986
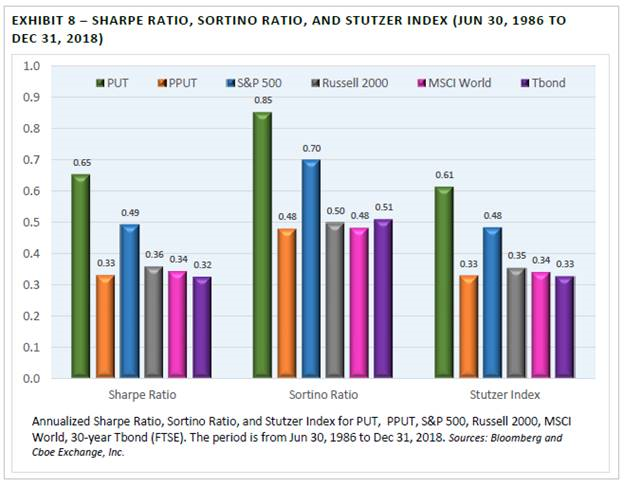
Professor Bondarenko’s paper analyzed the performance over more than 32 years (from June 30, 1986 to Dec. 31, 2018) of six benchmark indexes: the S&P 500, Russell 2000, MSCI World, Treasury bond and two benchmark indexes that engage in monthly transactions in SPX options.
Research showed the PUT Index had higher risk-adjusted returns (as measured by the Sharpe Ratio, Sortino Ratio and Stutzer Index) than the five other indexes studied.
 Sharpe, Sortino and Stutzer Explained
Some investors wonder if the Sharpe Ratio can be used for an index with negative skewness and a non-normal distribution because the Sharpe Ratio assumes a normal distribution. The Sharpe Ratio is often applied to the S&P 500 Index, a well-known index that has had negative skewness. In Bondarenko’s research, he found the skewness was negative for all options-based and stock indexes studied, including the PUT Index (-2.09) and the S&P 500 Index (-0.81). In light of the negative skewness, it’s worth noting the Stutzer Index was slightly lower than the Sharpe Ratio for both the PUT Index and the S&P 500 Index. However, based on the Sharpe and Sortino Ratios and the Stutzer Index, the PUT had higher risk-adjusted returns than the five other indexes studied. As Bondarenko notes in his paper, “Due to high volatility risk premium, PUT has delivered attractive risk-adjusted performance.”
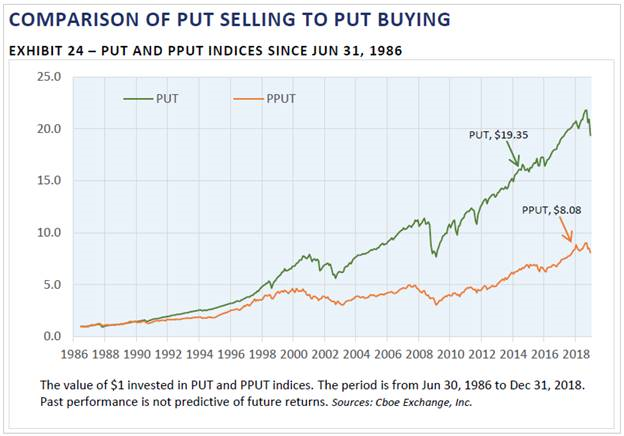
Much Higher Returns for Put-Selling vs. Put-Buying Index
Between 1986 and 2018, the PUT Index rose 1835% while the PPUT Index rose only 708%. As shown below, the VRP facilitated much higher returns for put-selling over the put-buying index.
 Key Takeaways
Learn More
Read more insights on Bondarenko's white paper, here. To read the full white paper, “Historical Performance of Put-Writing Strategies (2019),” visit www.cboe.com/Oleg.

