


Read More
The COVID-19 pandemic seemed to spark a major shift in trading and market structure, as people stayed home and new retail investors began trading. To determine the lasting impacts of this shift, Jeff Nguyen, Cboe Intern, analyzed displayed and non-displayed market centers between the first quarter of 2020 and the second quarter of 2021.
The COVID-19 pandemic brought forth one of the sharpest, most rapid declines and subsequent recoveries of asset prices in recent memory. Beginning on February 24, 2020 the S&P 500 Index ultimately decreased 35.4% over 24 trading sessions—a decline not seen since the 2008 Great Recession. Five months later, the index reversed its losses and reached new highs.
During the first year of the pandemic, the Cboe Equities Execution Consulting team observed three new trends in market microstructure:
As the U.S. economy roars back from an extraordinarily challenging year, we believe these market microstructure shifts appear to be lasting and will have consequential effects on the competition between displayed and non-displayed market centers.
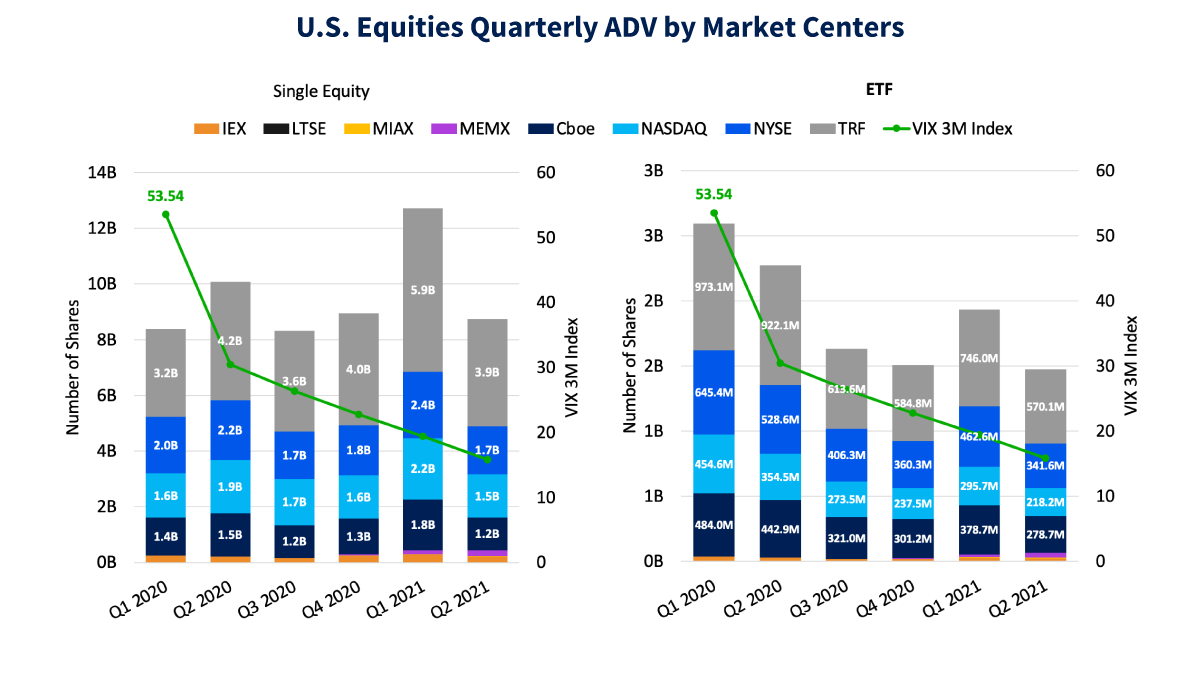
U.S. Equities volumes reached record highs throughout the global pandemic for both single equities and Exchange Traded Funds (ETFs). In the first quarter of 2020, the Cboe Volatility Index (VIX) reached a record quarterly average high of 53.54 as pandemic related uncertainty took hold. Across all U.S. market centers, the quarterly average daily trading volume (ADV) of single equities reached a record high of over 8.4 billion shares and the quarterly ADV of ETFs soared to 2.6 billion shares.
Data Source: SIP, Cboe.
More than a third of the record volumes in first-quarter 2020 were executed on non-displayed market centers, comprised of traditional Alternative Trading Systems (ATS) and principal broker-dealers, which execute client orders away from public exchanges (Exhibit 2).
Equity trading volumes continued to soar to new highs in the second quarter of 2020 as volatility subsided, investors regained confidence and markets pared previous losses. At the same time, non-displayed market centers continued to capture additional market share from exchanges at a rate of 107 basis points (bps) quarter-over-quarter in the Single Equities category, which is notably where the majority of the increased trading activity took place. Quarterly ETF ADV peaked early in the first-quarter 2020 selloff at 2.6 billion shares and declined to 1.5 billion shares in the second quarter of 2021. Most displayed market centers lost market share to non-displayed market centers in both single equities and ETFs during this period with the exception of Cboe, which gained 70 bps in ETF trading volume between first-quarter 2020 and second-quarter 2021.
Data Source: SIP, Cboe.
Over the past year and a half, Cboe’s Equities Execution Consulting team observed new growth in retail trading activities. Among non-displayed market centers, principal broker-dealers have been the largest beneficiary of this growth. Pre-pandemic, ATSs and principal broker-dealers had similar market share, with each holding 50.9% of non-displayed trading volume. By July 2020, principal broker-dealers’ market share climbed significantly, outpacing ATSs by 4,975 bps. At its peak in January 2021, the difference in market share between the two groups was 5,680 bps, likely driven by the “meme” stock trading phenomenon. We believe this significant shift in off-exchange execution introduces price transparency risks that Regulation National Market System (RegNMS) was created to address.
Data Source: FINRA.
In recent years, individual retail trading has grown as a result of the increased popularity of low cost indexing via ETFs and the subsequent retail brokerage shifts to low- or zero-commission models. This growth was personified by the explosive trading in “meme” names such as GameStop Corp. (GME) and AMC Entertainment Holdings Inc. (AMC).
Based on our team’s analysis, we believe the “Meme” stock trading phenomenon started much earlier than the sensationalized trading that took place in January 2021. To understand whether the retail trading events that made headlines in early 2021 were a one-time event or a prelude into a new and persistent trend, we created a program that scanned Reddit’s r/WallStreetBets forum for stock tickers and totaled the number of mentions for each ticker by day. We then studied the 15 most discussed social media “meme” stocks from January 2019 to present.
We compiled each stock’s total trading volume relative to the Total Composite Volume (TCV) and determined whether it was significant. We found that “meme” stock trading already accounted for a significant portion of the TCV before January 2021. On April 21, 2020, the combined trading volume of Ford (F), United States Oil ETF (USO), Snapchat (SNAP), Live Nation Entertainment (LYV), DuPont (DD), Macy’s (M) and Advanced Micro Devices (AMD) —just seven stocks — made up 11.6% of TCV, which includes about 3,000 stocks, as illustrated below. This activity continued moderately through most of 2020 and picked up steam later in the year with multiple days of trading volume above 10% TCV. “Meme” stocks such as GameStop (GME), AMC (AMC) and Planatir Technologies (PLTR) were already popular among the retail trading community well before the January and February 2021 headline events. “Meme” stock trading then experienced a period of relative inactivity between February and May 2021 before picking up traction again in late May. The renewed activity continued into June and July with multiple days of total volume above 10% TCV. These findings showed that the retail-fueled “Meme” stock trading surges were much more than a one time event.
Data Source: SIP, Company Data.
The “Meme” stock trading phenomenon fueled public scrutiny of retail order handling and payment for order flow arrangements, which led us to examine which market centers are the preferred market centers to execute “meme” stock order flows. Our findings showed that non-displayed market centers such as ATSs and principal broker-dealers are the preferred destination for “meme” stock order flow, capturing 54.7% of the trading volume in the daily top 15 “meme” stocks in the second quarter of 2021. Among displayed market centers, trades executed on Cboe’s exchanges accounted for 14.3% of the “meme” stock order flow in the second quarter of 2021. Cboe captured more “meme” stock volume during the quarter than every other displayed venue analyzed, with the exception of the New York Stock Exchange (NYSE), possibly due to Cboe’s innovative, retail-friendly products, such as the Retail Membership Program and Retail Priority.
Data Source: SIP, Company Data.
In recent years, we observed accelerated growth in trade volume in sub-dollar securities—stocks with listed price below $1 dollar—as well as sustained growth in stocks priced between $1 and $5. In first-quarter 2020, Cboe’s Equities Execution Consulting team noticed that volume in sub-dollar securities had increased significantly, to 6.1% total trade volume, a 61% increase from first-quarter 2019. Total trade volume grew to 10.5% the following quarter, as retail trading became more popular. This activity eventually settled at 5.2% of total trading volume in the second-quarter 2020. Stocks priced between $1 and $5 saw similar growth, increasing 7.4% from the first-quarter 2019 to the second-quarter 2020. In the first-quarter 2021, these securities saw the largest increase in trading volume, increasing 8.2% compared to the fourth-quarter 2019.
This increase coincided with the “Meme” stock trading activity in early 2021 in stocks such as AMC, and Sundial Growers (SNDL). Volume in securities priced between $5 and $10 dollars was also elevated during this period but has since settled back to pre-pandemic levels.
Coupled with the trading trends and activity detailed earlier, we believe growth in retail trading and “Meme” stocks were catalysts for shifts in investors’ sentiments toward lower priced securities. From a notional perspective, the composition remains largely unchanged with high-priced securities continuing to make up the largest notional volume, which is consistent with the ongoing expansion in asset prices.
Data Source: SIP
Additional evidence of increased retail trading is apparent in the volume-weighted bid/ask spreads of securities in different pricing groups. From the first quarter of 2019 to the second quarter of 2021, our team observed narrower spreads in sub-dollar securities. Conversely, stocks priced greater than $1 saw increasing spreads, while sub-dollar securities’ spreads narrowed from 1.8 cents in 2020 to 1.2 cents in 2021, as illustrated below. The rapid expansion of retail trading activities fueled liquidity in these “Meme” stocks —often lower-priced securities—, and as a result, tightened spreads.
This evident increase in retail trading activity highlights the importance of having a leveled and transparent playing field to encourage new investor participation. Currently, non-displayed market centers have an advantage over displayed market centers as regulations enabled them to execute in sub-penny increments. Consequently, these market centers have been the clear beneficiaries of the new retail trading wave.
Data Source: Cboe.
As investors and traders embrace the economic recovery, a healthy, transparent and level playing field for market centers is critical to U.S. financial market infrastructure. With more retail investors participating in the financial markets, it is crucial for U.S. regulatory agencies to maintain robust regulations to ensure fair competition between displayed and non-displayed market centers. Such transparency and fair competition are needed to instill trust in new market participants and provide them with a fair and transparent trading experience.
The Cboe North American Equities team continues to enhance its product offerings to optimize your trade execution and experience. Our market innovations, such as Retail Priority, Quote Depletion Protection and Early Trading, continue to add value for our clients by improving liquidity and the overall trading experience on Cboe’s exchanges. Please reach out to our coverage team with questions and to learn how we can help you optimize your trading experience.
Jeff Nguyen is currently earning a Master of Science in Finance at the University of Southern California. Additionally, he has a Bachelor of Commerce and an MBA from The University of British Columbia. Jeff is from Canada and enjoys rowing and archery in his spare time.
The information in this article is provided for general education and information purposes only. No statements within this article should be construed as a recommendation to buy or sell a security or futures contract or to provide investment advice. Supporting documentation for any claims, comparisons, statistics or other technical data in this article is available by contacting Cboe Global Markets at www.cboe.com/Contact. Options involve risk and are not suitable for all investors. Prior to buying or selling an option, a person must receive a copy of “Characteristics and Risks of Standardized Options.” Copies are available from your broker or from The Options Clearing Corporation at 125 South Franklin Street, Suite 1200, Chicago, IL 60606 or at www.theocc.com. Cboe Volatility Index and VIX are registered trademarks and of Cboe Exchange, Inc. All other trademarks and service marks are property of their respective owners. © 2021 Cboe Exchange, Inc. All Rights Reserved.