
Read More
Every year, global data and analytics firm FTSE Russell initiates a multi-week process known as Russell Reconstitution. First, publicly held companies are ranked based on their market capitalizations, narrowing the field to the largest 3,000 companies that represent approximately 97% of the investable U.S. equity market. This group comprises the stocks in the Russell 3000® Index.
The Russell 3000 and its subset indices, the Russell 1000® Index and the Russell 2000® Index, are reconstituted annually to ensure they accurately represent the market performance by each market segment and subsequent investment styles—growth, value, defensive and dynamic.
Russell 3000: Broad-based measurement of the 3,000 largest publicly held companies in the U.S. equity market. The average market cap is $471 billion.
Russell 1000: Measurement of the large-cap segment comprised of 1,000 largest securities or 93% of the U.S. equity market. The average market cap is $500 billion.
Russell 2000: Measurement of the small-cap segment comprised of 2,000 companies or 7% of the U.S. equity market. The average market cap is $3 billion.
The widely followed Russell Indices also serve as the basis for measuring performance of investible index products, including index tracking funds, Exchange Traded Funds (ETFs) and derivatives tracking over $10.6 trillion in assets.
Historically, the Russell Reconstitution process has culminated in the largest trading day of the year. After the reconstitution in June 2021, $186 billion in stocks was traded on the close.
As measured by total market capitalization, the 3,000 largest U.S. companies are ranked to become Russell 3000 Index constituents. Subsequently, each companies’ percentage weight within the index helps guide whether it becomes a constituent within the Russell 1000 or the Russell 2000.
A 5% band separates the Russell 1000 and Russell 2000 indices. Constituents within the band are evaluated relative to the current year’s market-cap breakpoint and allocated between large-cap or small-cap. In 2021, the breakpoint was $5.2 billion.

It’s reasonable for investors to anticipate a certain level of market impact coming from FTSE Russell’s annual reconstitution. Especially considering the magnitude of rebalancing multiple indices tracking over $10.6 trillion in assets often leads to the largest trading day of the year.
Several indicators frequently used by investors to forecast short-term levels of bullish or bearish sentiment come from options. For example, tracking volume on Russell 2000 Index options puts and calls using a put/call ratio can signal levels of market sentiment. Historically, the put/call ratio on index options tends to be skewed as investors can efficiently and cost-effectively hedge using index put options. Since 2015, the average put/call ratio on Russell 2000 Index (RUT) options during the Russell Reconstitution period was 1.71, which was slightly lower than the average of 1.84, indicating minimal change in market sentiment during that time.
Sources: Bloomberg & Cboe Global Markets
Implied volatility levels on options are another commonly used indicator to gauge short-term bullish or bearish market sentiment. In particular, the Russell 2000 Index implied volatility as measured by Cboe’s Russell 2000 Volatility Index (RVXSM) tracks the expected 30-day volatility of the Russell 2000 Index based on a series of RUT options pricing.
Since 2015, RVX is generally lower during Russell Reconstitution (May – June) compared to the annual RVX average. The comparable RVX averages indicate that market participants don’t typically expect a significant change in market pricing during Russell Reconstitution, with the exceptions of 2019 and 2020, as highlighted in the chart below.
Source: Bloomberg & Cboe Global Markets
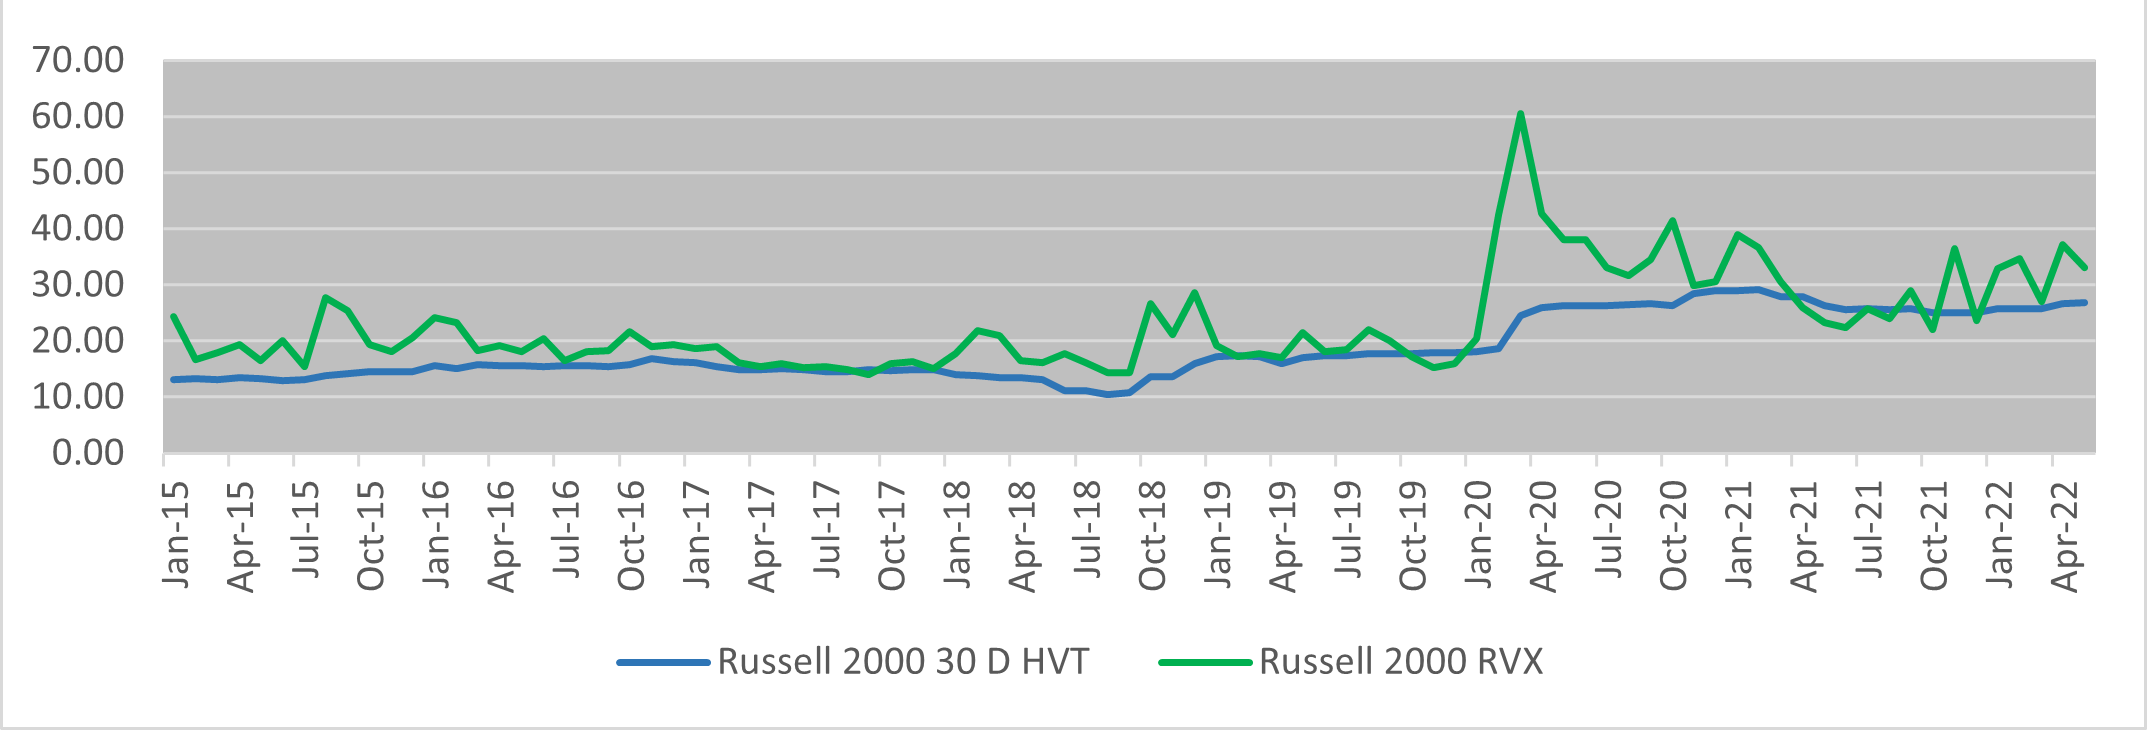
As a small-cap benchmark, the Russell 2000 Index reflects higher risks associated with small-cap companies and generally carries a higher implied volatility relative to its large-cap counterpart.
RUT’s elevated implied volatility translates to a higher volatility risk premium (VRP) between the implied volatility as measured by the RVX Index minus RUT’s 30-Day Historical Volatility (HVT). The average difference between the RVX Index and the 30-Day Historical Volatility over the past seven years has been approximately 3.65%.
The higher volatility risk premium provides investors with potential opportunities to harvest volatility risk premiums used to enhance risk-adjusted returns on portfolios benchmarked to the Russell indices or generate income using well-defined option-writing strategies.
Sources: Bloomberg & Cboe Global Markets
As an investment tool, listed options on the Russell 2000 Index allow investors to target risk or returns for a specific time period through various option writing strategies. When considering RUT option writing strategies, it’s worth noting that over 50% of RUT option volume is within RUT Weeklys options, which has expirations on Mondays, Wednesdays and Fridays, as well as at the end of each month and quarter.
Follow the links below for more information on option-writing strategies using Russell 2000 Index options and to learn more about the Cboe-exclusive cash-settled options on Russell Indices.
General
The information provided is for general education and information purposes only. No statement provided should be construed as a recommendation to buy or sell a security, future, financial instrument, investment fund, or other investment product (collectively, a “financial product”), or to provide investment advice.
In particular, the inclusion of a security or other instrument within an index is not a recommendation to buy, sell, or hold that security or any other instrument, nor should it be considered investment advice.
Options
Options involve risk and are not suitable for all market participants. Prior to buying or selling an option, a person should review the Characteristics and Risks of Standardized Options (ODD), which is required to be provided to all such persons. Copies of the ODD are available from your broker or from The Options Clearing Corporation, 125 S. Franklin Street, Suite 1200, Chicago, IL 60606.
Trading FLEX options may not be suitable for all options-qualified market participants. FLEX options strategies only should be considered by those with extensive prior options trading experience.
Uncovered option writing is suitable only for the knowledgeable market participant who understands the risks, has the financial capacity and willingness to incur potentially substantial losses, and has sufficient liquid assets to meet applicable margin requirements. In this regard, if the value of the underlying instrument moves against an uncovered writer's options position, the writer may incur large losses in that options position and the participant’s broker may require significant additional margin payments. If a market participant does not make those margin payments, the broker may liquidate positions in the market participant’s account with little or no prior notice in accordance with the market participant’s margin agreement.
Futures
Futures trading is not suitable for all market participants and involves the risk of loss, which can be substantial and can exceed the amount of money deposited for a futures position. You should, therefore, carefully consider whether futures trading is suitable for you in light of your circumstances and financial resources. You should put at risk only funds that you can afford to lose without affecting your lifestyle.
For additional information regarding the risks associated with trading futures and security futures, see respectively the Risk Disclosure Statement set forth in Appendix A to CFTC Regulation 1.55(c) and the Risk Disclosure Statement for Security Futures Contracts.
VIX® Index and VIX® Index Products
The Cboe Volatility Index® (known as the VIX Index) is calculated and administered by Cboe Global Indices, LLC. The VIX Index is a financial benchmark designed to be a market estimate of expected volatility of the S&P 500® Index and is calculated using the midpoint of quotes of certain S&P 500 Index options as further described in the methodology, rules and other information here.
VIX futures and Mini VIX futures, traded on Cboe Futures Exchange, LLC, and VIX options, traded on Cboe Options Exchange, Inc. (collectively, “VIX® Index Products”), are based on the VIX Index. VIX Index Products are complicated financial products only suitable for sophisticated market participants.
Transacting in VIX Index Products involves the risk of loss, which can be substantial and can exceed the amount of money deposited for a VIX Index Product position (except when buying options on VIX Index Products, in which case the potential loss is limited to the purchase price of the options).
Market participants should put at risk only funds that they can afford to lose without affecting their lifestyles.
Before transacting in VIX Index Products, market participants should fully inform themselves about the VIX Index and the characteristics and risks of VIX Index Products, including those described here. Market participants also should make sure they understand the product specifications for VIX Index Products (VIX futures, Mini VIX futures and VIX options) and the methodologies for calculating the underlying VIX Index and the settlement values for VIX Index Products. Answers to questions frequently asked about VIX Index products and how they are settled is available here.
Not Buy and Hold Investment: VIX Index Products are not suitable to buy and hold because:
Volatility: The VIX Index is subject to greater percentage swings in a short period of time than is typical for stocks or stock indices, including the S&P 500 Index.
Expected Relationships: Expected relationships with other financial indicators or financial products may not hold. In particular:
Final settlement Value: The method for calculating the final settlement value of a VIX Index Product is different from the method for calculating the VIX Index at times other than settlement, so there can be a divergence between the final settlement value of a VIX Index Product and the VIX Index value immediately before or after settlement. (See the SOQ Auction Information section here for additional information.)
Exchange Traded Products ("ETPs")
Cboe does not endorse or sell any ETP or other financial product, including those investment products that are or may be based on a Cboe index or methodology or on a non-Cboe index that is based on investment products trading on a Cboe Company exchange (e.g., VIX futures); and Cboe makes no representations regarding the advisability of investing in such products. An investor should consider the investment objectives, risks, charges, and expenses of these products carefully before investing. Investors also should carefully review the information provided in the prospectuses for these products.
Investments in ETPs involve risk, including the possible loss of principal, and are not appropriate for all investors. Non-traditional ETPs, including leveraged and inverse ETPs, pose additional risks and can result in magnified gains or losses in an investment. Specific risks relating to investment in an ETP are outlined in the fund prospectus and may include concentration risk, correlation risk, counterparty risk, credit risk, market risk, interest rate risk, volatility risk, tracking error risk, among others. Investors should consult with their tax advisors to determine how the profit and loss on any particular investment strategy will be taxed.
Cboe Strategy Benchmark Indices
Cboe Strategy Benchmark Indices are calculated and administered by Cboe Global Indices, LLC as described in the methodologies, rules and other information available here using information believed to be reliable, including market data from exchanges owned and operated by other Cboe Companies.
Strategy Benchmark Indices are designed to measure the performance of hypothetical portfolios comprised of one or more derivative instruments and other assets used as collateral. Past performance is not indicative of future results. Strategy Benchmark Indices are not financial products that can be invested in directly but can be used as the basis for financial products or managing portfolios.
The actual performance of financial products such as mutual funds or managed accounts can differ significantly from the performance of the underlying index due to execution timing, market disruptions, lack of liquidity, brokerage expenses, transaction costs, tax consequences and other considerations that may not be applicable to the subject index. Index and Benchmark Values Prior to Launch Date
Index and benchmark values for the period prior to an index’s launch date are calculated by a theoretical approach involving back-testing historical data in accordance with the methodology in place on the launch date (unless otherwise stated). A limitation of back-testing is that it reflects the theoretical application of the index or benchmark methodology and selection of the index’s constituents in hindsight. Back-testing may not result in performance commensurate with prospective application of a methodology, especially during periods of high economic stress in which adjustments might be made. No back-tested approach can completely account for the impact of decisions that might have been made if calculations were made at the same time as the underlying market conditions occurred. There are numerous factors related to markets that cannot be, and have not been, accounted for in the preparation of back-tested index and benchmark information.
Taxes
No Cboe Company is an investment adviser or tax advisor, and no representation is made regarding the advisability or tax consequences of investing in, holding or selling any financial product. A decision to invest in, hold or sell any financial product should not be made in reliance on any of the statements or information provided. Market participants are advised to make an investment in, hold or sell any financial product only after carefully considering the associated risks and tax consequences, including information detailed in any offering memorandum or similar document prepared by or on behalf of the issuer of the financial product, with the advice of a qualified professional investment adviser and tax advisor.
Under section 1256 of the Tax Code, profit and loss on transactions in certain exchange-traded options and futures are entitled to be taxed at a rate equal to 60% long-term and 40% short-term capital gain or loss, provided that the market participants involved, and the strategy employed satisfy the criteria of the Tax Code. Market participants should consult with their tax advisors to determine how the profit and loss on any particular option or futures strategy will be taxed. Tax laws and regulations change from time to time and may be subject to varying interpretations.
General
Past performance of an index or financial product is not indicative of future results.
Brokerage firms may require customers to post higher margins than any minimum margins specified.
No data, values or other content contained in this document (including without limitation, index values or information, ratings, credit-related analyses and data, research, valuations, strategies, methodologies and models) or any part thereof may be modified, reverse-engineered, reproduced or distributed in any form or by any means, or stored in a database or retrieval system, without the prior written permission of Cboe.
Cboe does not guarantee the accuracy, completeness, or timeliness of the information provided. THE CONTENT IS PROVIDED “AS IS” WITHOUT WARRANTY OF ANY KIND, EITHER EXPRESS OR IMPLIED, INCLUDING, WITHOUT LIMITATION, ANY WARRANTY WITH RESPECT MERCHANTABILITY OR FITNESS FOR A PARTICULAR PURPOSE.
Hypothetical scenarios are provided for illustrative purposes only. The actual performance of financial products can differ significantly from the performance of a hypothetical scenario due to execution timing, market disruptions, lack of liquidity, brokerage expenses, transaction costs, tax consequences and other considerations that may not be applicable to the hypothetical scenario.
Supporting documentation for statements, comparisons, statistics or other technical data provided is available by contacting Cboe at www.cboe.com/Contact.
The views of any third-party speakers or third-party materials are their own and do not necessarily represent the views of any Cboe Company. That content should not be construed as an endorsement or an indication by Cboe of the value of any non-Cboe financial product or service described.
The inclusion of research not conducted or explicitly endorsed by Cboe should not be construed as an endorsement or indication of the value of that research.
Trademarks and Intellectual Property
Cboe®, Cboe Global Markets®, Bats®, BIDS Trading®, BYX®, BZX®, Cboe Options Institute®, Cboe Vest®, Cboe Volatility Index®, CFE®, EDGA®, EDGX®, Hybrid®, LiveVol®, Silexx® and VIX® are registered trademarks, and Cboe Futures ExchangeSM, C2SM, f(t)optionsSM, HanweckSM, and Trade AlertSM are service marks of Cboe Global Markets, Inc. and its subsidiaries. Standard & Poor's®, S&P®, S&P 100®, S&P 500® and SPX® are registered trademarks of Standard & Poor's Financial Services LLC and have been licensed for use by Cboe Exchange, Inc. Dow Jones®, Dow Jones Industrial Average®, DJIA® and Dow Jones Global Indexes® are registered trademarks or service marks of Dow Jones Trademark Holdings, LLC, used under license. Russell, Russell 1000®, Russell 2000®, Russell 3000® and Russell MidCap® names are registered trademarks of Frank Russell Company, used under license. FTSE® and the FTSE indices are trademarks and service marks of FTSE International Limited, used under license. MSCI and the MSCI index names are service marks of MSCI Inc. (“MSCI”) or its affiliates and have been licensed for use by Cboe. All other trademarks and service marks are the property of their respective owners.
Copyright
© 2021 Cboe Exchange, Inc. All Rights Reserved.