Read More

The National Football League (NFL) kicked off their season on September 9th when the Dallas Cowboys played last year’s super bowl champs, the Tampa Bay Buccaneers. Because they generate billions of dollars in revenue annually, professional sports have become increasingly quantitative just like global equity markets.
General managers of these elite teams leverage a wide variety of data points and metrics to yield the best results. Following suit, fantasy football owners give considerable time and attention to constructing their rosters, which are essentially indexing tools.
Specific positions may be given a higher weighting based on scoring goals. For example, football has become much more of an air game (passing) as opposed to ground (running) over the past decade. As such, quarterbacks and receivers have greater relative value compared to running backs.
For most of the past two decades, growth stocks have outperformed relative to value companies. Over the past three months, S&P 500® Index growth stocks are up over 10% whereas the value components are unchanged. The ratio of growth/value is just below all-time highs. Style matters from a performance perspective.
That backdrop has me considering the makeup (“rosters”) of two well-known U.S. equity indexes. First, the S&P 500, which tracks the performance of roughly 500 U.S.-listed, large cap corporations. It’s a market cap weighted index and the size of the top constituents has grown significantly. As a result, the top five names in the S&P 500 (AAPL, MSFT, GOOGL, AMZN, and FB) now make up ~23% of the overall index. The chart below highlights the skew toward “the Big 5” and how much it’s grown since 2016.

If we broaden the lens slightly to include the top ten names, the total weight becomes “only” 28.5%. That group would include GOOG (C shares), TSLA, NVDA, BRK/B and JPM. AAPL itself makes up 6.2% of the S&P 500 Index performance.
The top companies in the S&P 500 are “household names.” Chances are you interact with one or each of those companies frequently. Perhaps you use an Apple or Microsoft laptop to search something in Google or place an Amazon order. Everyday stuff!
Let’s compare that to the second equity “roster.” The Russell 2000® Index tracks the performance of roughly 2000 U.S.-listed small cap companies. The Russell 2000 is also cap weighted, but it includes about four times as many constituent names (~500 v. ~2000), all of which have lower valuations.
The top roster spots in the Russell 2000 do not have the same recognition. AMC Entertainment is the largest current holding, but it only makes up 0.65% of the overall index. The top ten constituents in the Russell have a total weight of about 3.15%. In other words, index performance is much more evenly distributed in the Russell when compared to the S&P 500.
This is not a judgement, and one is not better or worse than the other. They are simply unique, and those attributes should be understood if you’re benchmarking your performance to one index or the other.

In a general sense, individual investors are all general managers or fantasy football owners. However, the financial stakes are far more significant in capital markets. I’m a casual football fan and don’t participate in fantasy football. If the Chicago Bears end up 6-11 this year, my financial well-being is not impacted.
By contrast, the fact that the Russell 2000 has outperformed the S&P 500 by about 1400 basis points over the past 52 weeks is a material data point.
Source: LiveVol Pro
If we broaden our time horizon, the perspective changes. Looking back two years, small-caps (Russell 2000) have lagged relative to large-cap (S&P 500) by 800 basis points. A forthcoming research piece from EQ Derivatives compared the Russell 2000 Total Return (TR) Index to the S&P 500 TR Index going back to 2000. As you can see in the chart below, the Russell 2000 TR Index has notably exceeded the S&P 500 TR Index.

The relative index paths are distinct. When you zoom in, there are periods of underperformance and outperformance. That brings us to volatility. The average annualized standard deviation of returns for the Russell 2000 comes to 20.27%. The S&P 500 volatility measure is 15.10%. Those measures are both backward looking calculations, like any realized volatility metric.
Implied volatility (IV) is a forward-looking estimate based on option prices. IV is often influenced by historical measures. As such, RUT/MRUT (Russell 2000/Mini-Russell 2000) index options typically trade with a higher implied volatility compared to SPX/XSP (S&P 500/Mini-S&P 500) index options.
Using twelve years of historical data, the Cboe Russell 2000 Volatility IndexSM (RVX) (which applies the VIX methodology using RUT options as inputs) has closed at a premium to the Cboe Volatility Index® (VIX® Index) 98.6% of the time. In percentage terms, the average RVX premium over the same time frame works out to 28.8%.
In IV terms, on average, 1-month RUT options trade at a 29% premium to 1-month SPX options. That’s not better or worse. It is in large part a function of the historical tendency for the small-cap index to experience greater volatility than the large-cap index.

With this background established, we can now look at the interesting dynamics playing out with respect to realized and implied vols as well as the relationship between IV levels (term structure) across index products.
For more about types of volatility, check out this month’s Simply Put below.
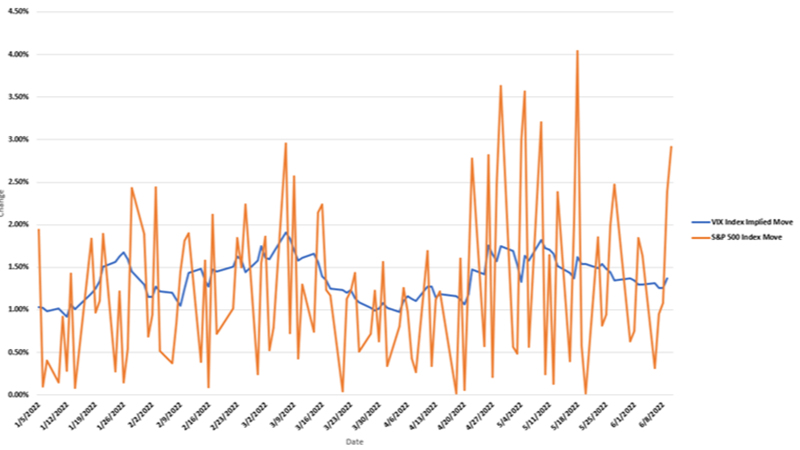
30-day historical volatility for the S&P 500 Index is ~7.5%. That’s a low measurement in any environment and the lowest reading since before SARS-Cov-2 was understood as a macro risk. Despite a lack of daily volatility, the VIX Index remains around 19%.
Recall, the VIX Index is an expected 30-day forward volatility measure. The VIX Index often measures at a premium to 30-day trailing S&P 500 volatility. This is referred to as Implied Volatility Risk Premium, and a variety of option trading strategies are employed to capitalize on the spread.
At present the spread is unusually wide. In other words, the SPX options market doesn’t expect the near future to resemble the past month. SPX options trading on an 19% IV are pricing daily changes of about 1.19%. To be fair, the ATM (at-the-money) SPX options with 30 days until maturity are trading on an IV around 14.5%, implying daily shifts of 0.9%.
The VIX Index incorporates a wide strip of options. The OTM (out-of-the-money) calls and puts are trading at much higher volatility levels than the 50 delta options. That “skew” dynamic has been persistent for months.
The last time there was a divergence of this magnitude – between 1-month realized and forward volatility for the S&P 500 – was ahead of the 2016 U.S. elections. At this time, there are no “known” catalysts of that potential consequence on the calendar.
Term structure analysis is one way for market participants to analyze how IV levels change relative to time (maturity). There are a handful of ways to quantify term structure for options, but they all compare similar options (ATM v. ATM/ 30 delta call/put v. 30 delta call/put, etc.) with different expiries.
With that in mind, the term structure in SPX options is approaching a decade high. In short, there is a significant IV spread between similar SPX options with different maturities. The implied volatility premium for long-dated SPX options is historically wide.
There is a relationship between the VIX futures term structure and SPX options. Generally, the VIX futures with longer-dated maturities trade over (at a premium to) shorter-dated futures. Similarly, an ATM option in the S&P 500 Index with 120 days until expiration generally trades with a higher IV than a 30-day ATM option.
Intuitively, the more time until expiration, the more opportunity for a market to make a large move. The likelihood of a 10% higher or lower move for the broad market over the next two weeks is lower than if our window is expanded to two months and so on.
Currently the ATM SPX options that expire in September 2022 (360 days) are trading on a 19.5% IV. The ATM options that expire in 30 days are trading on a 14.5% IV, a difference of 5.0 vols. Alternatively, the 1-year SPX options are trading at a 35% vol premium to the 1-month options. That’s unusually high.
Now look at the VIX futures term structure and consider what’s driving the steepness. Plotting term structure for VIX futures is relatively straightforward. There’s no delta consideration to standardize the comparison. You simply look at the prices for VIX futures with different maturities. Here’s a look at VIX term structure as of September 13th.

The short end of the curve is trading around 20 with the VIX Index measuring at a similar level. The May 2022 VIX futures are trading just over 26. The 1-year VIX Index is measuring 26.75. Again, we see a steep term structure.
Here are some questions to consider:
In brief, short term implied volatilities (SPX) are trading at an unusual premium relative to short term realized vols. Furthermore, the spread between short term IVs and longer-term SPX IVs are historically wide.
The options market has repriced risk across maturities in the “Post March 2020” world. Global equity and derivative markets must now contend with (and price in) the potential for infection swells. Previous outbreaks have impacted economies, labor markets, and the path toward recovery.
Economic stability has been bolstered by a variety of temporary safety nets. The additional unemployment insurance of $300/week lapsed in early September, which will affect about seven million Americans. Three other federal unemployment benefits ended at the same point in time.
Will there be continued weakness in retail sales or consumer confidence measures as a result? Time will tell, but options markets seem to be pricing the possibility.
Other potential risk catalysts include: the prospect of “tapering” by the Fed, the “seasonal” trend for higher macro vol in October, lofty P/E ratios, and eventually the 2022 mid-term elections.
If we closed the books on investment performance for 2021 in the middle of September, it would be one of the least volatile years for the S&P 500 in history. To date, the largest closing drawdown for the broad market is 4.2%. Compare that to last year where the S&P 500 declined by nearly 34% at one point.
Outliers will skew averages, but since 1928 (large sample size), the average calendar year drawdown for the S&P 500 is 16.33%. Below you can see the breakdown by decade.
The other comparable years, with respect to small drawdowns include:
Perhaps you believe that drawdown risk is diminished in a zero interest rate environment with active central banks. Looking at the data, the average drawdown between 2010 and 2019 is nearly 12%, and this year’s peak-to-trough decline is only 4.2%.
A fitting analogy here brings us back to fantasy football. Imagine a fantasy team where your key positions all remain healthy (no injuries) and perform quite well throughout the season. It’s a winning scenario. Is it one that will continue?
Time will tell, but option markets continue to price in more volatility than has been experienced in both the short and longer term. That information is valuable, but the prices give rise to opportunity if you have a trading thesis.
The roster for your portfolio changes over time. “Winning” approaches shift as well. Bill Walsh ushered in a new era in football with his West Coast style offense. Perhaps Ben Bernanke, Janet Yellen, and Jerome Powell have introduced a new era for investors. The zero-interest rate world is not one devoid of risk.
2021 has been atypical thus far, but there’s significant uncertainty on the horizon. Volatility markets in part reflect that outlook. They are tools that can be employed to embed strength across roster spots and a portfolio that may be more resilient in times of duress.
To learn more, join the Options Institute and our Adjunct Faculty for one of our edifying upcoming events: https://www.cboe.com/education/#events.
Get the Inside Volatility Trading newsletter directly in your inbox by signing up here.
The information in this article is provided for general education and information purposes only. No statement(s) within this article should be construed as a recommendation to buy or sell a security or futures contract, as applicable or to provide investment advice. Supporting documentation for any claims, comparisons, statistics or other technical data in this article is available by contacting Cboe Global Markets at www.cboe.com/Contact.
Past performance is not indicative of future results. Hypothetical scenarios are provided for illustrative purposes only. The actual performance of financial products can differ significantly from the performance of a hypothetical scenario due to execution timing, market disruptions, lack of liquidity, brokerage expenses, transaction costs, tax consequences and other considerations that may not be applicable to the hypothetical scenario.
Futures trading is not suitable for all investors, and involves the risk of loss. The risk of loss in futures can be substantial and can exceed the amount of money deposited for a futures position. You should, therefore, carefully consider whether futures trading is suitable for you in light of your circumstances and financial resources. For additional information regarding futures trading risks, see the Risk Disclosure Statement set forth in the Risk Disclosure Statement set forth in Appendix A to CFTC Regulation 1.55(c) and the Risk Disclosure Statement for Security Futures Contracts.
This e-mail has been sent to you because you: 1) are a current or former subscriber to cboe.com; 2) have requested information from Cboe in the past; or 3) have been identified as an investment professional with interest in the subject matter.
Cboe®, Cboe Global Markets®, CFE®, Cboe Volatility Index®, and VIX® are registered trademarks and Cboe Futures Exchange™ and Mini VIXTM are service marks of Cboe Exchange, Inc. or its affiliates. Standard & Poor’s®, S&P®, S&P 500®, and SPX® are registered trademarks of Standard & Poor’s Financial Services, LLC, and have been licensed for use by Cboe Exchange, Inc. All other trademarks and service marks are the property of their respective owners.
Options involve risk and are not suitable for all investors. Prior to buying or selling an option, a person must receive a copy of "Characteristics and Risks of Standardized Options." Copies are available from your broker or from The Options Clearing Corporation at 125 S. Franklin Street, Suite 1200, Chicago, IL 60606 or at www.theocc.com.
© 2021 Cboe Exchange, Inc. All Rights Reserved.