Inside Volatility Trading: New Year, New Probabilities, New Risk
Kevin Davitt
▬
January 19, 2022

A new year tends to bring hope, expectations, and for some, the intent to make changes. In capital markets before the calendars flip to January there are countless efforts at prognostication. You can find a synopsis of some of the big banks’ forecasts for the S&P 500 Index in 2022 here, or here, or here.
There will never be consensus because (as we point out often) the future is always uncertain. In general, investors and the research teams at banks tend to expect the future to look like the recent past. There’s also a tendency to overweight the probability of recent – potentially rare – events repeating themselves.
This availability bias is an investigation into where probability and expectations diverge. Probability is quantitatively driven and there are discernable answers. Expectations are subjective but may be informed by a given probability as well as your risk exposure. Let’s explore how option markets are a valuable reflection of expectations, probabilities, and risk.
Probabilities
Probability is the likelihood of a specific event/outcome occurring. It’s typically reflected in percentages (0% - 100%). Examples often reference rolling a six-sided die. The probability of rolling a six is 1/6 = 0.166 or 16.6%.
More complicated math is involved when calculating something like the probability of winning Powerball. You need to use the Combination Formula.
Combination Formula

Where: nCr = number of combinations
n = total number of objects in the set
r = number of choosing objects from the set
The “!” symbol is a factorial, where a number is multiplied by all the numbers before it
The probability of winning Powerball (you must match five balls drawn from a drum containing balls numbered 1 – 69 and match one ball drawn from a second drum with balls numbered 1 – 26) works out to 1/292,201,338.
Combinations assume that outcome order doesn’t matter. We do not need to see the Powerball numbers appear in the same order that we selected them in; we simply need to see that all of our numbers match the numbers generated by the Powerball machine. You need to use a Permutation Formula if the order does matter and here are some practical examples.
Translation: You should not expect to win Powerball because the probability of winning is exceptionally low.
Curious to know more about probabilities? Check out this edition’s Simply Put!

Annual Returns
Let’s turn our attention to the broad market. The visual below buckets annual S&P 500* (Total Return Index) performance by deciles. The data covers 1926 – 2021 and the highlighted number illustrates the frequency (in years) when S&P 500 Index returns fell into each performance bucket.
For example, the S&P 500 Total Return Index gained 40% or more during a calendar year five times.
S&P 500 Index Annual Return Performance
 Source: Cboe Options Institute
We can establish expectations for equity markets based on history, but expectation is not the same as probability. This calls to mind the ubiquitous disclaimer on any financial media: “past performance is not indicative of future results.”
In a game of chance, probabilities do not change. In capital markets, change is a constant. Consequently, there are unique opportunities as well as different risks.
We know based on historical data that from 1926 – 2021 the large cap equity index (S&P 500 Index®) generally returned between -20% and +20%. In 54 (green highlighted portion) of the past 95 years, annual performance has fallen within that range. However, that does not mean there’s a (54/95 = 0.5684) 56.84% probability that that pattern is followed in 2022.
There’s no “right answer” because the future remains uncertain.
Our expectations may be appropriately informed by history, but you can’t calculate probabilities the same way you do with games of chance. In the markets there are limitless potential outcomes.
Historical S&P 500 Index Outcomes (1926 – 2021)
- Mean annual return +11.9%
- Min/Max annual return: -43.8% & +52.6%
Stock market performance over the past five years has been exceptional (mean +19.7%). Since 2008, the S&P 500 Index has averaged a positive annual return of 16.6% with only one down year. It’s easy to calculate averages and make assumptions, but every year is an independent event. Past performance is not indicative of future results.
Alternative
So, what’s the alternative?
Well, the options market is replete with valuable information. You need to know where to look and how to interpret the data. Below is a snapshot of the Standard December 2022 SPX options with the index measuring 4700 (January 6, 2022).
Delta Chart

Source: Cboe LiveVol & Options Institute
What does this table tell us about probabilities and risks?
The option Greek delta can serve multiple roles. Delta represents how much an options theoretical value should change for each one point move in the underlying. Delta is also an estimate of the likelihood of the underlying expiring above/below a given strike.
For example, with the S&P 500 Index measuring 4700 the implied probability of the S&P 500 Index expiring above 5800 was 7.1%. That probability (delta) is sensitive to the existing implied volatility assumptions, which change over time. All else equal, a higher volatility assumption would yield a higher probability (and vice versa). The SPX Index measuring 5800 would represent a 23% rally (change from spot) before December 16, 2022.
What’s the implied probability of a 23% decline in spot by the same point in time?
In other words, what’s the delta of the 3600 put?
15%.
Based on this information, the implied probability of a 23% advance is just over 7% whereas a decline of 23% has a 15% implied probability. Why such divergence? Based on the first chart, it looks like S&P 500 Index returns are positively skewed on an annual basis. There are more outcomes on the right side of the median (0% return). Does the market currently reflect significant concern about inflation or Omicron?
The short answer is no, which is typical for the index options market. Let’s understand why.
Vol Skew
Based on history, we know that equity markets tend to move up gradually. We also know that they can reprice risk and sell off quickly. There are countless examples of that dynamic. In the October edition of Inside Volatility, we focused on “Black Monday” and the emergence of index option skew.
During the early portion of the pandemic, it took about a month for the S&P 500 Index to lose 33% of its value. Then it took five months for the index to make new highs. That was a highly unusual recovery. On average, it takes two years for the S&P 500 Index to make new highs following a bear market.
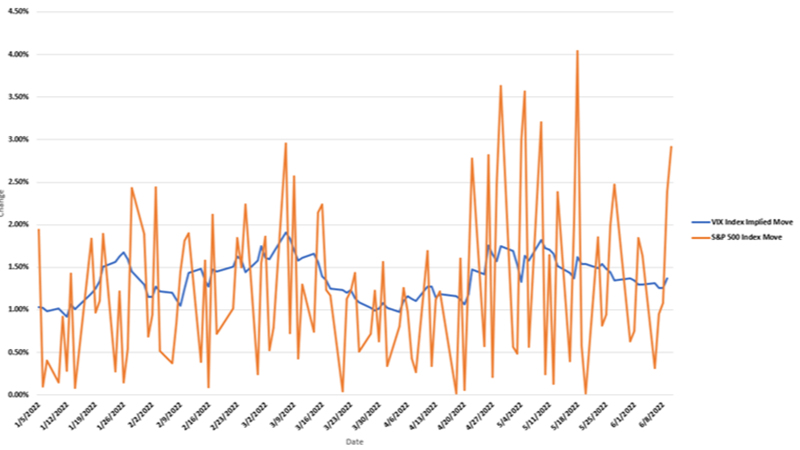
On a related note, implied volatility (IV) for index options tends to decline when the market moves higher. IVs typically increase when the market sells off. The long-term negative correlation between the S&P 500 Index and the VIX Index® is a great example.
SPX Index & VIX Index Long-Term Negative Correlation
 Source: Bloomberg
The visuals highlight the negative S&P 500 Index correlation to the VIX Index. On a daily basis, over the past five years the correlation has ranged between -0.38 and -0.95. If you look at the weekly correlation over the past decade the range vacillates between -0.54 and -0.94. Correlations change over time, but typically when the S&P 500 Index moves higher, the VIX Index declines (and vice versa) (although that relationship is not always maintained).
Building off that point, if the S&P 500 Index is up 23% in December 2022, chances are implied volatility will be lower than current measures. Conversely, if the S&P 500 Index is trading closer to 3600 (down 23%), implied volatilities will likely be substantially higher.
Option greeks, including delta, are impacted by volatility assumptions. The imbalanced probability we just highlighted, where the 23% out-of-the-money (OTM) call and 23% OTM puts have a very different delta, is skew at work. This dynamic is most pronounced at “the wings,” the extreme ends of the distribution curve.
If we compare the up/down 11% strikes (4200 put and 5200 call) the deltas are only slightly different. Looking back at our annual performance by decile visual, history says the odds of up <10% are equal to down <10% for the year.
The other key factor for index options is the fact that collectively market risk is tilted to the downside. Investors of all types are asset owners. Shareholders benefit from equity index values increasing. Based on last year’s performance and data from S&P Global, roughly $16 trillion (USD) in assets are indexed to the S&P 500 Index. Assuming linear exposure, if the broad market declines by 10%, about $1.6 trillion in wealth is lost.
As such, there’s a natural desire for protection. There’s also a willingness on the part of some market participants to forgo some upside to finance protection. In short, there’s consistent demand for left tail (downside) protection. There’s also a steady supply of right tail (OTM calls) options used to offset the cost of “portfolio insurance.”
That combination skews the supply and demand dynamic for OTM downside relative to upside. Ergo, the volatility implied by equidistant S&P 500 Index calls and puts is different.
Expectations & Perspective
“Life is like topography, Hobbes. There are summits of happiness and success, flat stretches of boring routine and valleys of frustration and failure.” – Calvin & Hobbes
My first favorite “author” was Bill Watterson. I grew up looking forward to the weekend for several reasons, but the Sunday comics and a new Calvin & Hobbes strip were certainly included. Bill Watterson was able to convey powerful truths about the world through the eyes of six-year-old boy. Calvin believed in shaping one’s own reality by changing either one’s own perspective or the perspectives of those around. He knew that learning was complicated and sometimes very difficult. The big picture lessons I took from Calvin & Hobbes are ones I see reflected in the markets to this day.
Expectations for economic growth and potential S&P 500 Index returns are lower when compared to years past. The probability of multiple rate hikes (based on current Fed Fund futures prices) is high.
Similarly, an options delta, which is a proxy for probability, is impacted by the option’s implied volatility. “Probability” in the context of the markets is different than pure mathematical calculations because the path and potential outcomes are infinite.
That reality gave rise to continued growth in options. 2021 was another blockbuster year for equity, ETF, and Index options. More than 9.8 billion total options were traded and cleared by the OCC. More and more people have chosen to learn about and use options to shape and define potential outcomes over a specific time frame and to gauge collective risk.
This year will likely bring some summits of success as well as valleys of frustration and failure.
Here’s to 2022. Will it look like the recent past? Time will tell.
*S&P 500 Index launched in 1957: Composite Index 1926 – 1956
Industry News
Events
Volatility411
Get This Newsletter Sent to Your Inbox
Get the Inside Volatility Trading newsletter directly in your inbox by signing up here.
There are important risks associated with transacting in any of the Cboe Company products discussed here. Before engaging in any transactions in those products, it is important for market participants to carefully review the disclosures and disclaimers below.
General
- The information provided is for general education and information purposes only. No statement provided should be construed as a recommendation to buy or sell a security, future, financial instrument, investment fund, or other investment product (collectively, a “financial product”), or to provide investment advice.
- In particular, the inclusion of a security or other instrument within an index is not a recommendation to buy, sell, or hold that security or any other instrument, nor should it be considered investment advice.
Options
- Options involve risk and are not suitable for all market participants. Prior to buying or selling an option, a person should review the Characteristics and Risks of Standardized Options (ODD) , which is required to be provided to all such persons. Copies of the ODD are available from your broker or from The Options Clearing Corporation, 125 S. Franklin Street, Suite 1200, Chicago, IL 60606.
- Trading FLEX options may not be suitable for all options-qualified market participants. FLEX options strategies only should be considered by those with extensive prior options trading experience.
- Uncovered option writing is suitable only for the knowledgeable market participant who understands the risks, has the financial capacity and willingness to incur potentially substantial losses, and has sufficient liquid assets to meet applicable margin requirements. In this regard, if the value of the underlying instrument moves against an uncovered writer's options position, the writer may incur large losses in that options position and the participant’s broker may require significant additional margin payments. If a market participant does not make those margin payments, the broker may liquidate positions in the market participant’s account with little or no prior notice in accordance with the market participant’s margin agreement.
Futures
- Futures trading is not suitable for all market participants and involves the risk of loss, which can be substantial and can exceed the amount of money deposited for a futures position. You should, therefore, carefully consider whether futures trading is suitable for you in light of your circumstances and financial resources. You should put at risk only funds that you can afford to lose without affecting your lifestyle.
- For additional information regarding the risks associated with trading futures and security futures, see respectively the Risk Disclosure Statement set forth in Appendix A to CFTC Regulation 1.55(c) and the Risk Disclosure Statement for Security Futures Contracts.
VIX® Index and VIX® Index Products
- The Cboe Volatility Index® (known as the VIX Index) is calculated and administered by Cboe Global Indices, LLC. The VIX Index is a financial benchmark designed to be a market estimate of expected volatility of the S&P 500® Index, and is calculated using the midpoint of quotes of certain S&P 500 Index options as further described in the methodology, rules and other information here .
- VIX futures and Mini VIX futures, traded on Cboe Futures Exchange, LLC, and VIX options, traded on Cboe Options Exchange, Inc. (collectively, “VIX® Index Products”), are based on the VIX Index. VIX Index Products are complicated financial products only suitable for sophisticated market participants.
- Transacting in VIX Index Products involves the risk of loss, which can be substantial and can exceed the amount of money deposited for a VIX Index Product position (except when buying options on VIX Index Products, in which case the potential loss is limited to the purchase price of the options).
- Market participants should put at risk only funds that they can afford to lose without affecting their lifestyles.
- Before transacting in VIX Index Products, market participants should fully inform themselves about the VIX Index and the characteristics and risks of VIX Index Products, including those described here. Market participants also should make sure they understand the product specifications for VIX Index Products ( VIX futures , Mini VIX futures and VIX options ) and the methodologies for calculating the underlying VIX Index and the settlement values for VIX Index Products. Answers to questions frequently asked about VIX Index products and how they are settled is available here .
- Not Buy and Hold Investment: VIX Index Products are not suitable to buy and hold because:
- On their settlement date, VIX Index Products convert into a right to receive or an obligation to pay cash.
- The VIX Index generally tends to revert to or near its long-term average, rather than increase or decrease over the long term.
- Volatility: The VIX Index is subject to greater percentage swings in a short period of time than is typical for stocks or stock indices, including the S&P 500 Index.
- Expected Relationships: Expected relationships with other financial indicators or financial products may not hold. In particular:
- Although the VIX Index generally tends to be negatively correlated with the S&P 500 Index – such that one tends to move upward when the other moves downward and vice versa – that relationship is not always maintained.
- The prices for the nearest expiration of a VIX Index Product generally tend to move in relationship with movements in the VIX Index. However, this relationship may be undercut, depending on, for example, the amount of time to expiration for the VIX Index Product and on supply and demand in the market for that product.
- Mini VIX futures contracts trade separately from regular-sized VIX futures, so the prices and quotations for Mini VIX futures and regular-sized VIX futures may differ because of, for example, possible differences in the liquidity of those markets.
- Final settlement Value: The method for calculating the final settlement value of a VIX Index Product is different from the method for calculating the VIX Index at times other than settlement, so there can be a divergence between the final settlement value of a VIX Index Product and the VIX Index value immediately before or after settlement. (See the SOQ Auction Information section here for additional information.)
Exchange Traded Products ("ETPs")
- Cboe does not endorse or sell any ETP or other financial product, including those investment products that are or may be based on a Cboe index or methodology or on a non-Cboe index that is based on investment products trading on a Cboe Company exchange (e.g., VIX futures); and Cboe makes no representations regarding the advisability of investing in such products. An investor should consider the investment objectives, risks, charges, and expenses of these products carefully before investing. Investors also should carefully review the information provided in the prospectuses for these products.
- Investments in ETPs involve risk, including the possible loss of principal, and are not appropriate for all investors. Non-traditional ETPs, including leveraged and inverse ETPs, pose additional risks and can result in magnified gains or losses in an investment. Specific risks relating to investment in an ETP are outlined in the fund prospectus and may include concentration risk, correlation risk, counterparty risk, credit risk, market risk, interest rate risk, volatility risk, tracking error risk, among others. Investors should consult with their tax advisors to determine how the profit and loss on any particular investment strategy will be taxed.
Cboe Strategy Benchmark Indices
- Cboe Strategy Benchmark Indices are calculated and administered by Cboe Global Indices, LLC as described in the methodologies, rules and other information available here using information believed to be reliable, including market data from exchanges owned and operated by other Cboe Companies.
- Strategy Benchmark Indices are designed to measure the performance of hypothetical portfolios comprised of one or more derivative instruments and other assets used as collateral. Past performance is not indicative of future results. Strategy Benchmark Indices are not financial products that can be invested in directly, but can be used as the basis for financial products or managing portfolios.
- The actual performance of financial products such as mutual funds or managed accounts can differ significantly from the performance of the underlying index due to execution timing, market disruptions, lack of liquidity, brokerage expenses, transaction costs, tax consequences and other considerations that may not be applicable to the subject index. Index and Benchmark Values Prior to Launch Date
- Index and benchmark values for the period prior to an index’s launch date are calculated by a theoretical approach involving back-testing historical data in accordance with the methodology in place on the launch date (unless otherwise stated). A limitation of back-testing is that it reflects the theoretical application of the index or benchmark methodology and selection of the index’s constituents in hindsight. Back-testing may not result in performance commensurate with prospective application of a methodology, especially during periods of high economic stress in which adjustments might be made. No back-tested approach can completely account for the impact of decisions that might have been made if calculations were made at the same time as the underlying market conditions occurred. There are numerous factors related to markets that cannot be, and have not been, accounted for in the preparation of back-tested index and benchmark information.
Taxes
- No Cboe Company is an investment adviser or tax advisor, and no representation is made regarding the advisability or tax consequences of investing in, holding or selling any financial product. A decision to invest in, hold or sell any financial product should not be made in reliance on any of the statements or information provided. Market participants are advised to make an investment in, hold or sell any financial product only after carefully considering the associated risks and tax consequences, including information detailed in any offering memorandum or similar document prepared by or on behalf of the issuer of the financial product, with the advice of a qualified professional investment adviser and tax advisor.
- Under section 1256 of the Tax Code, profit and loss on transactions in certain exchange-traded options and futures are entitled to be taxed at a rate equal to 60% long-term and 40% short-term capital gain or loss, provided that the market participants involved and the strategy employed satisfy the criteria of the Tax Code. Market participants should consult with their tax advisors to determine how the profit and loss on any particular option or futures strategy will be taxed. Tax laws and regulations change from time to time and may be subject to varying interpretations.
General
- Past performance of an index or financial product is not indicative of future results.
- Brokerage firms may require customers to post higher margins than any minimum margins specified.
- No data, values or other content contained in this document (including without limitation, index values or information, ratings, credit-related analyses and data, research, valuations, strategies, methodologies and models) or any part thereof may be modified, reverse-engineered, reproduced or distributed in any form or by any means, or stored in a database or retrieval system, without the prior written permission of Cboe.
- Cboe does not guarantee the accuracy, completeness, or timeliness of the information provided. THE CONTENT IS PROVIDED “AS IS” WITHOUT WARRANTY OF ANY KIND, EITHER EXPRESS OR IMPLIED, INCLUDING, WITHOUT LIMITATION, ANY WARRANTY WITH RESPECT MERCHANTABILITY OR FITNESS FOR A PARTICULAR PURPOSE.
- Hypothetical scenarios are provided for illustrative purposes only. The actual performance of financial products can differ significantly from the performance of a hypothetical scenario due to execution timing, market disruptions, lack of liquidity, brokerage expenses, transaction costs, tax consequences and other considerations that may not be applicable to the hypothetical scenario.
- Supporting documentation for statements, comparisons, statistics or other technical data provided is available by contacting Cboe at www.cboe.com/Contact .
- The views of any third-party speakers or third-party materials are their own and do not necessarily represent the views of any Cboe Company. That content should not be construed as an endorsement or an indication by Cboe of the value of any non-Cboe financial product or service described.
- The inclusion of research not conducted or explicitly endorsed by Cboe should not be construed as an endorsement or indication of the value of that research.
Trademarks and Intellectual Property
- Cboe®, Cboe Global Markets®, Bats®, BIDS Trading®, BYX®, BZX®, Cboe Options Institute®, Cboe Vest®, Cboe Volatility Index®, CFE®, EDGA®, EDGX®, Hybrid®, LiveVol®, Silexx® and VIX® are registered trademarks, and Cboe Futures ExchangeSM, C2SM, f(t)optionsSM, HanweckSM, and Trade AlertSM are service marks of Cboe Global Markets, Inc. and its subsidiaries. Standard & Poor's®, S&P®, S&P 100®, S&P 500® and SPX® are registered trademarks of Standard & Poor's Financial Services LLC and have been licensed for use by Cboe Exchange, Inc. Dow Jones®, Dow Jones Industrial Average®, DJIA® and Dow Jones Global Indexes® are registered trademarks or service marks of Dow Jones Trademark Holdings, LLC, used under license. Russell, Russell 1000®, Russell 2000®, Russell 3000® and Russell MidCap® names are registered trademarks of Frank Russell Company, used under license. FTSE® and the FTSE indices are trademarks and service marks of FTSE International Limited, used under license. MSCI and the MSCI index names are service marks of MSCI Inc. (“MSCI”) or its affiliates and have been licensed for use by Cboe. All other trademarks and service marks are the property of their respective owners.
Copyright
© 2022 Cboe Exchange, Inc. All Rights Reserved.