


Read More
Cboe recently announced plans to list Tuesday-expiring SPX Weeklys (SPXW) options on April 18, and Thursday-expiring SPXW options on May 11. With this change, near-term SPXW expirations will be available five days a week. Investors have expressed interest in additional SPXW options expirations to facilitate greater precision in their investment and risk management strategies. SPXW options may also help investors manage portfolio exposures and volatility, as well as generate premium income. Read on to learn about growth in SPXW options trading, the benefits of weekly expirations and trading strategies to consider.
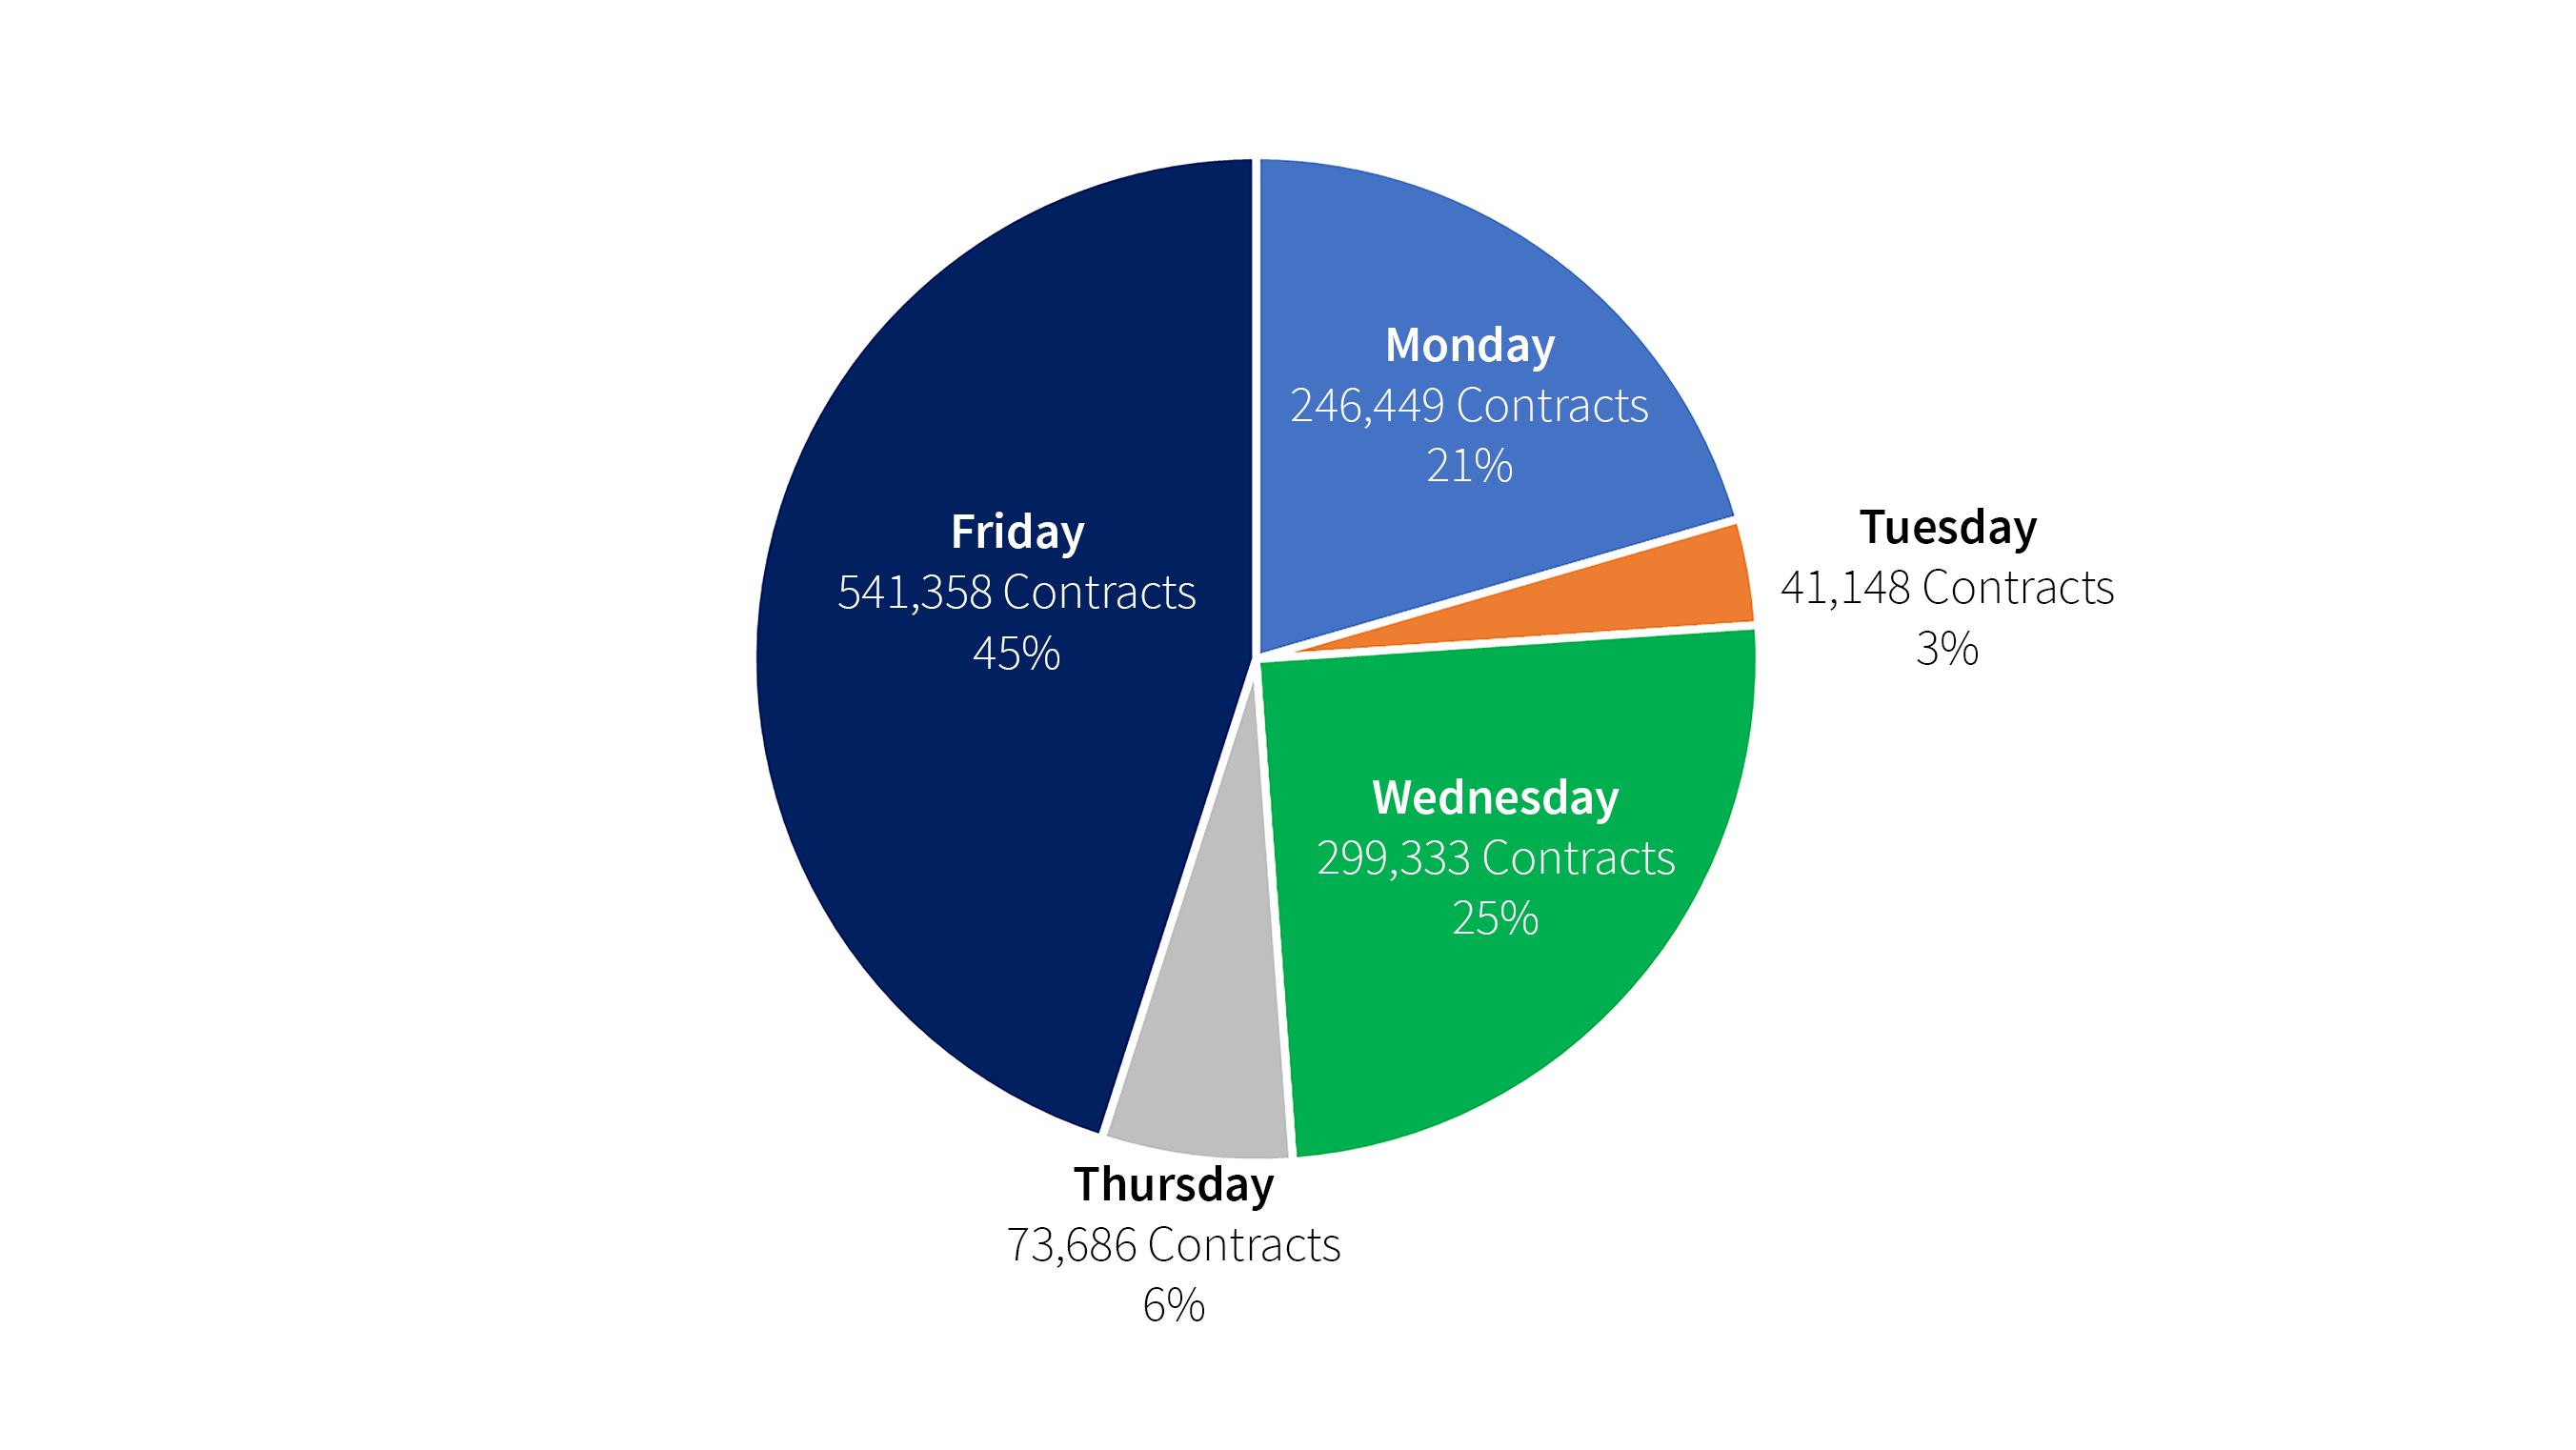
Strong Volume for SPXW Options with Expirations on Mondays, Wednesdays and Fridays
SPXW options are similar to standard monthly SPX options but shorter in term, with weekly expirations. In the first quarter of 2022, the average daily volume (ADV) for the PM-settled S&P 500 SPXW options was:
*9% of the ADV was for SPXW options that expire on Tuesdays or Thursdays because of holidays and end-of-month expirations.
Source: Cboe Global Markets
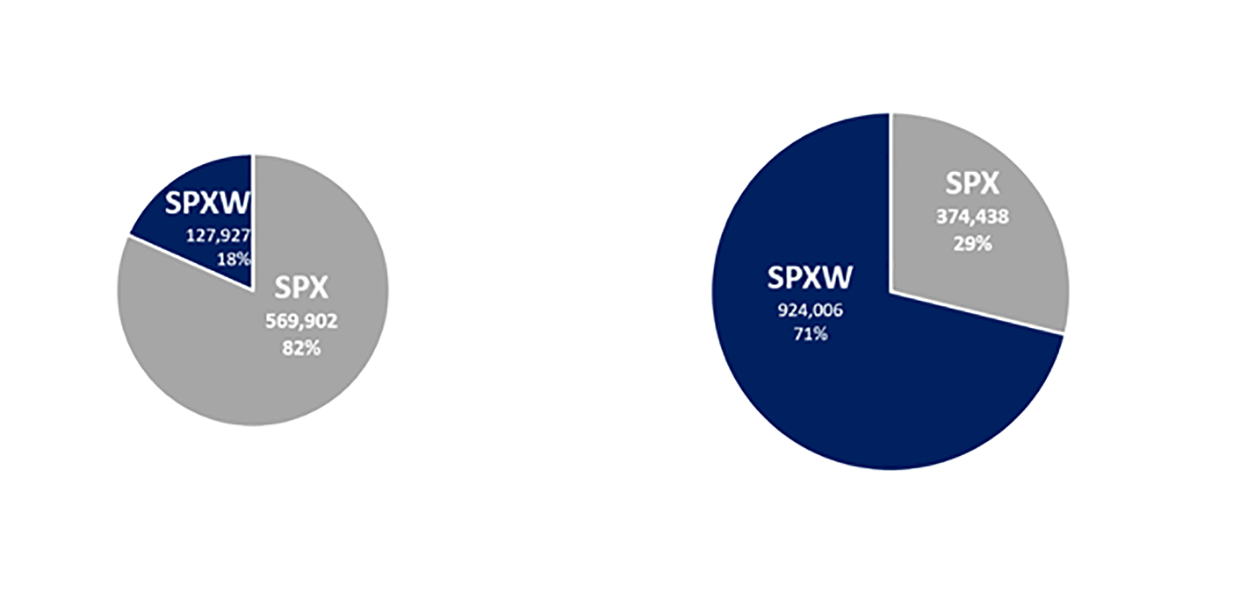
SPXW Options Grew 622% Between 2012 and 2021
ADV for SPXW options grew from 127,927 contracts in 2012 to 924,006 contracts in 2021, a 622% increase. Notably, ADV in SPXW options is now larger than that of standard SPX options. The growth may be due to PM-expirations, cash settlement, large size and added precision with more expirations.
Source: Cboe Global Markets
Growth in Share for Short-Dated Options
The share of overall U.S.-listed options volume for short-dated options —contracts with 0 to 10 days to expiration— increased from around 23% in 2011 to 49% in 2021. This growth may be because of the addition of more frequent expirations, more accessible trading information and lower trading commissions. A trader selling a short-dated covered option may receive more options premium than a trader selling a longer-dated option on the same underlying instrument.
Source: Estimates by Cboe Global Markets for U.S.-listed options
Day-of-the-Week Analyses for S&P 500 and VIX® Indices
Plenty of research has been done in an effort to discover trends and patterns of the S&P 500 Index and the Cboe Volatility Index® (VIX Index), including seasonal patterns or anomalies regarding the time of the day, day of the week and month of the year.
According to The North American Journal of Economics and Finance, there appears to be a seasonal pattern in the daily VIX Index measure that is not apparent in the daily S&P 500 Index log-returns series. Notably, there is an inverted effect in the VIX Index on Mondays, but no similar trend observed in the S&P 500 return series.
The chart below shows that the VIX Index experienced the biggest average change on Mondays.
January 2000 - March 2020
*Arithmetic average of percent changes from previous daily close to the next daily close.
Source: Cboe Global Markets
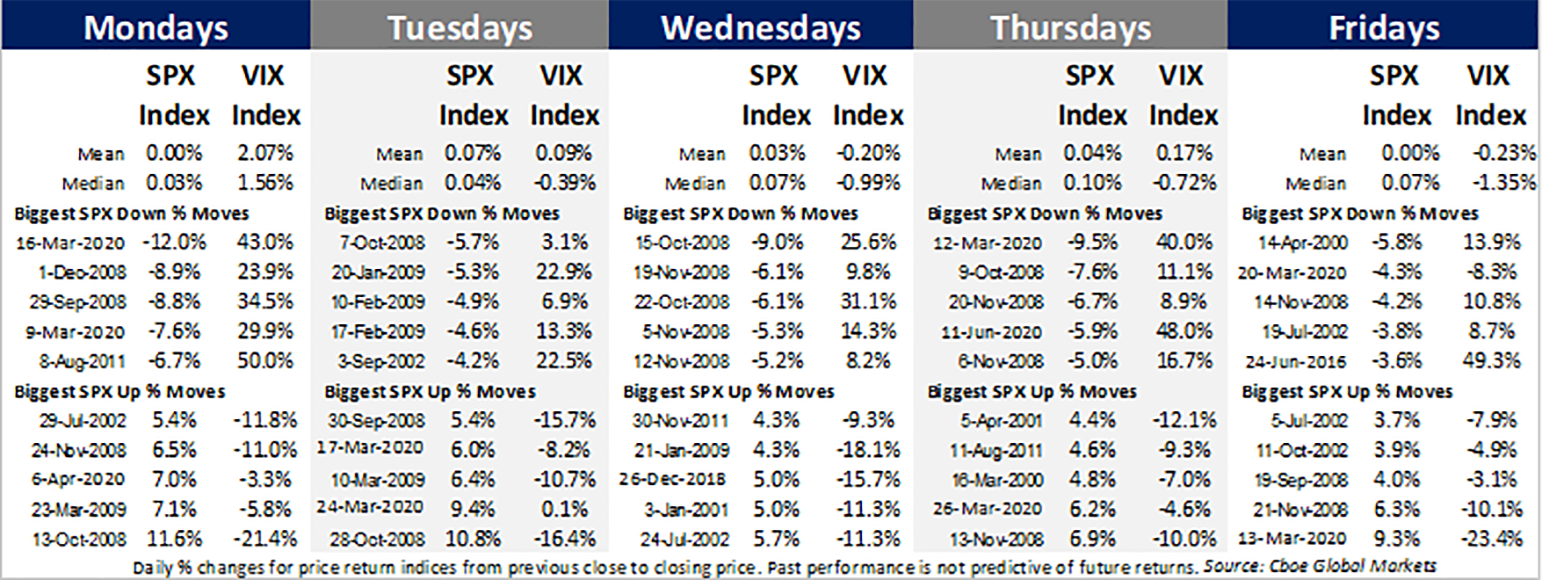
In comparison, the S&P 500 Index had both its biggest down move (down 12%) and its biggest up move (up 11.5%) on Mondays.
Largest Daily Percent Moves of the S&P 500 and VIX Indices
S&P 500 Index Term Structure and the Calendar Spread Strategy
The term structure chart below shows the implied volatility estimates on April 3 for 56 expiration dates for:
The implied volatility estimates for near-term S&P 500 puts are substantially higher for the OTM options than the ATM options. The S&P 500 4200 OTM puts that expired on April 8 had an implied volatility of 25.7, while the S&P 500 4545 ATM puts had an implied volatility of 13.9.
*Estimates for implied volatility.
Source: Cboe Global Markets
Strategy Idea: The Calendar Spread strategy may be useful for options investors who expect a change in a steep term structure. The strategy could involve the purchase of one option with a low implied volatility and the sale of one option with a higher implied volatility. Both options have different expiration dates and the same strike price.
S&P 500 Index Volatility Skew and the Vertical Spread Strategy
There are noteworthy differences in the implied volatilities (IVs) for the near-term one-week options OTM puts at 80% moneyness (IV of 60.2), compared to the OTM calls at 102.5% moneyness (IV of 13.7). Implied volatility for OTM S&P 500 options puts often is driven higher because of demand for products to hedge downside portfolio risk. In comparison, the term structure curve is flatter and the IVs ranged from 33.3 to 13.8 for longer-dated 3 month options.
Implied volatility estimates on April 6, 2022
Source: Cboe Global Markets
Strategy Idea: The Vertical Spread strategy may be useful for investors who are intrigued by the negative skewness often shown by index options. This strategy could involve buying an option with a lower implied volatility and selling an option with a higher implied volatility. Both options have the same expiration date but different strike prices.
Performance of Strategy that Sells One-Week SPXW Options
The Cboe S&P 500 One-Week PutWrite Index (WPUTSM) is a key index to consider when exploring the use of short-dated options strategies. The WPUT Index is designed to reflect a strategy that holds one-month U.S. Treasury bills and sells S&P 500 Index options every Friday, 52 times a year.
Historical Performance for Put-Writing Strategies by Professor Oleg Bondarenko provides a detailed analysis of the performance of the WPUT Index and the Cboe S&P 500 PutWrite Index (PUTSM), an index that sells one-month cash-secured SPX puts 12 times a year. The excerpt from Professor Bondarenko’s paper below shows that the WPUT Index collected significant options premiums. Additionally, the average aggregate annual gross premium collected by the WPUT Index was 37.1%, compared to 22.1% for the PUT Index.
Source: Historical Performance for Put-Writing Strategies
While the amounts of the gross premiums are positive, it is important to note that the net returns for the PUT, WPUT and S&P 500 indices all were negative in 2008 and in 2018.
*Total return pre-tax indices. Past performance is not indicative of future results.
Source: Cboe Global Markets
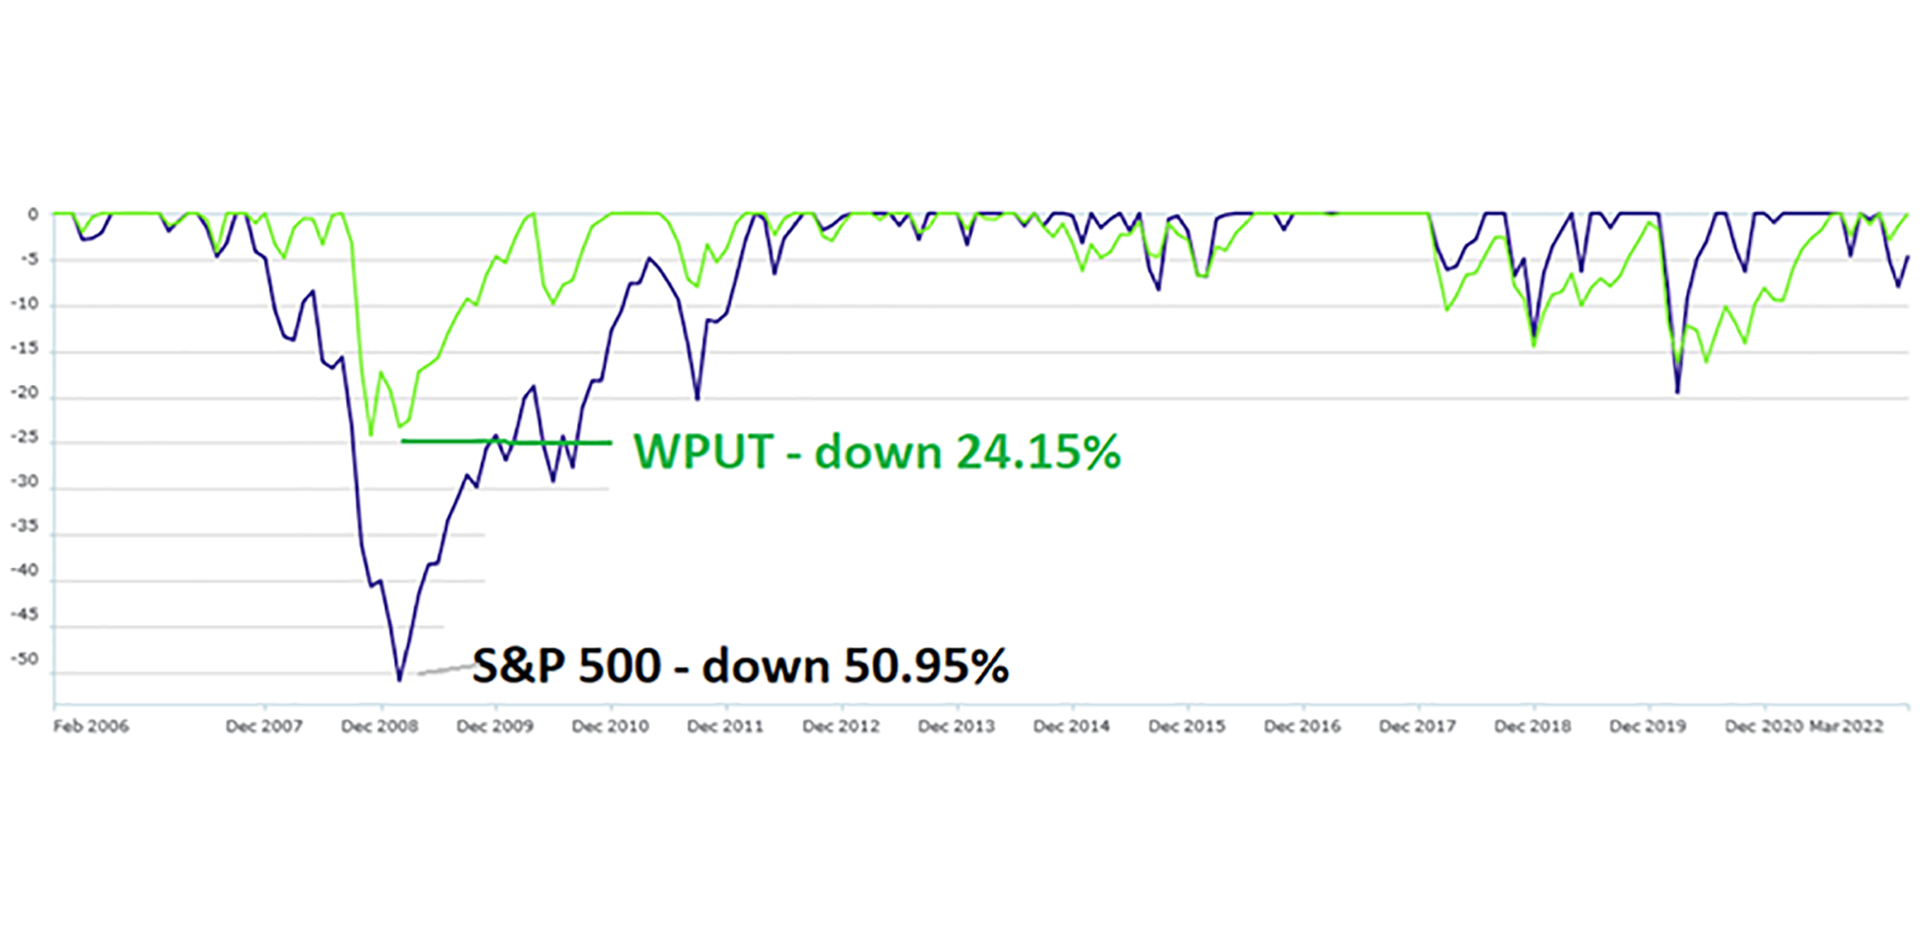
Since its inception in 2006, the WPUT Index’s largest drawdown was 24.14%, while the S&P 500 Index’s worst drawdown was 50.95%, a statistic that may make the WPUT Index attractive to risk-averse investors. In regimes with falling stock prices and higher implied volatility, the WPUT Index has the potential to collect higher premiums that may serve as a cushion in bear markets.
Total return pre-tax indices
Sources: Zephyr and Cboe Global Markets
Additionally, risk-averse investors often prefer strategies with lower standard deviations. As shown in the table below, the WPUT Index has the lowest standard deviation compared to several other comparable indices.
Total return pre-tax indices.
Source: Zephyr and Cboe Global Markets
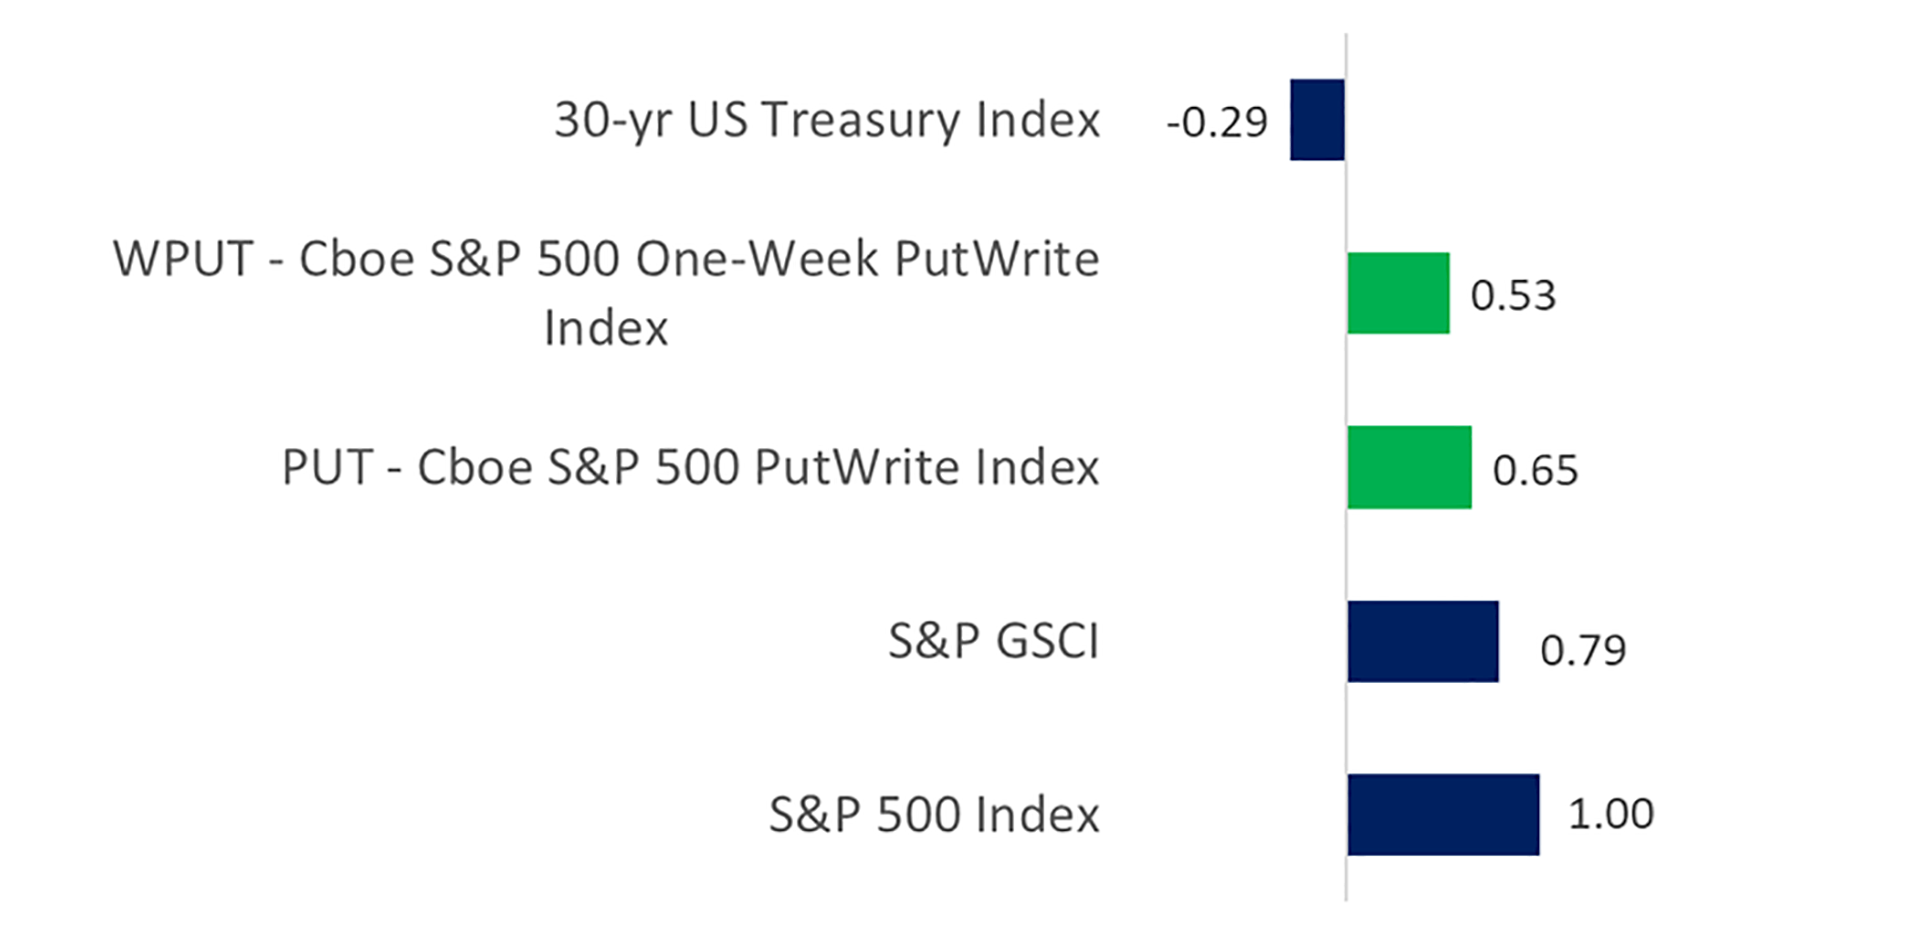
Lower Betas
Investors seeking to diversify portfolios often invest in assets with lower betas. The WPUT Index had a beta of 0.53 to the S&P 500 Index, which is lower than the betas for three comparable indices.
Total return pre-tax indices.
Source: Zephyr and Cboe Global Markets
Annualized Returns
Both the WPUT and PUT indices sell ATM cash-secured put options. Compared to OTM option writing, ATM writing often collects more premium but does not participate in the upside moves of the stock market. Additionally, the annualized returns for ATM option-writing can underperform the stock index during bull markets.
Total return pre-tax indices
Source: Zephyr and Cboe Global Markets
Additional expirations for SPXW options make the weekly contracts more accessible, enabling investors to manage exposure, hedge volatility and generate premiums with SPXW options each day of the week. With SPXW options available five-days a week, investors can achieve greater precision to reach their goals.
Learn more about how SPXW options may help manage portfolio exposures and volatility, and generate premium income.
Cboe currently offers a variety of large-sized, cash-settled S&P 500 options.
Learn more about our S&P 500 Index options suite here.
There are important risks associated with transacting in any of the Cboe Company products discussed here. Before engaging in any transactions in those products, it is important for market participants to carefully review the disclosures and disclaimers contained at https://www.cboe.com/options_futures_disclaimers.