


Read More
Equities trading activity among retail investors has increased significantly in the past two years, primarily due to the introduction of zero commission trading and the debut of innovative new retail trading platforms. Cboe’s Equities Execution Consulting team examined this trend, along with the retail meme stock trading phenomenon, with a series of analyses including, A Deep Dive into US Equities Trading Venues, The Lasting Results of an Unprecedented Market Environment and Interlisted Trading Trends and Opportunities. These analyses showed how the influx of retail participant order flow and meme stock trading impacted the U.S. and Canadian equities markets but left us wondering about the impact on options markets. To find out, we examined meme stock retail trading activity on the U.S. equities and options markets in our latest analysis.
We have been compiling the top 15 stocks mentioned each day on the Reddit r/wallstreetbets forum since 2019. Our latest analysis examines those stocks along with unique data sets from Cboe Data Shop, a source of innovative and expansive trading data across numerous asset classes, to examine the initial and overall impact on the most popular stocks discussed on the forum.
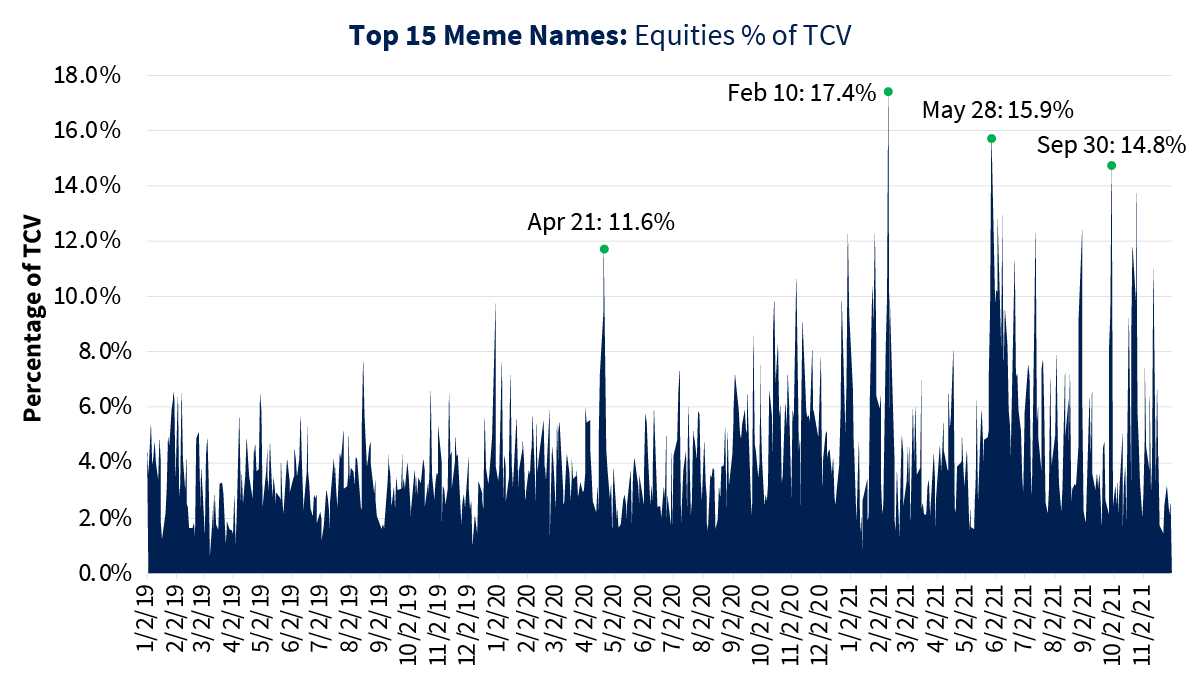
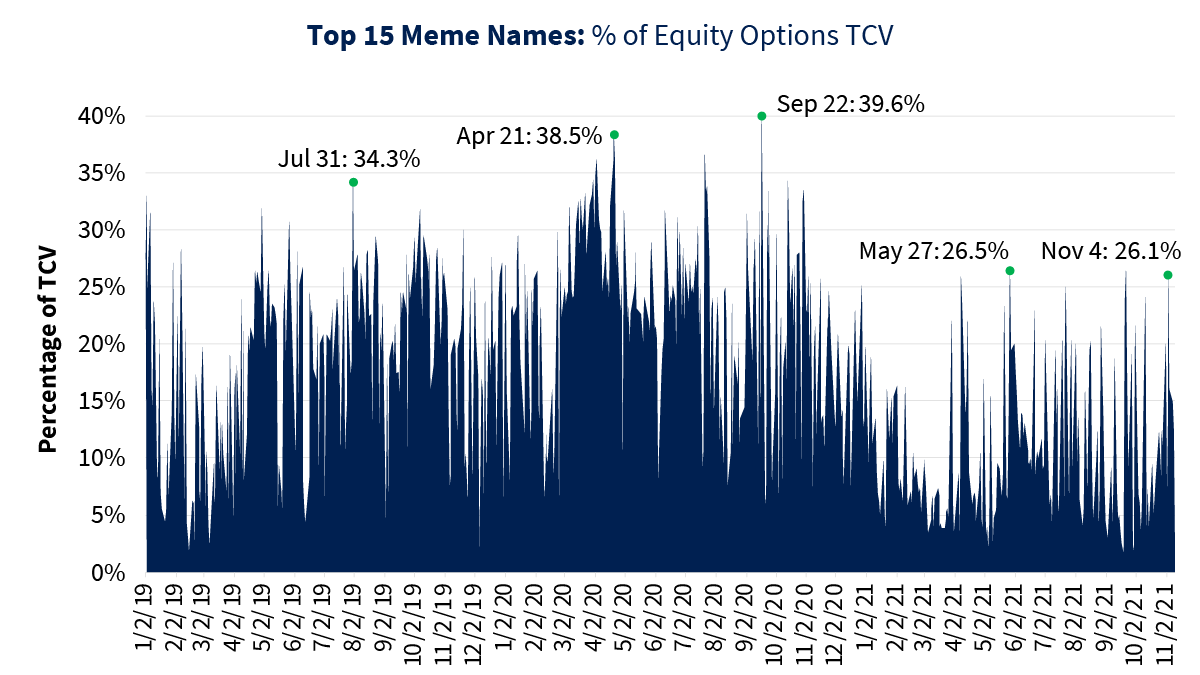
The charts below show the daily percentage of total volume for the top 15 meme stocks in U.S. equities and options. In 2020, the meme stocks accounted for 4.2% of total equity volume, while in 2021, the meme stocks accounted for 5.0% of total equity volume. Outside of the stocks that are well-known for being popular with retail clients, such as GameStop (GME), AMC Theaters (AMC) and Tilray (TLRY), the list of top 15 stocks has recently included Sundial (SNDL), Naked Juice (NAKD), Roblox (RBLX), SmileDirect Club (SDC) and Skillz, Inc. (SKLZ). With the exclusion of index options, meme stocks accounted for 21.4% of total options volume in 2020 and declined to 10.1% in 2021. Overall options volume in meme stocks declined from 2020 to 2021, but there are still a number of days where these stocks make up more than 25% of total options volume.
Data Source: OCC, Cboe, Reddit.
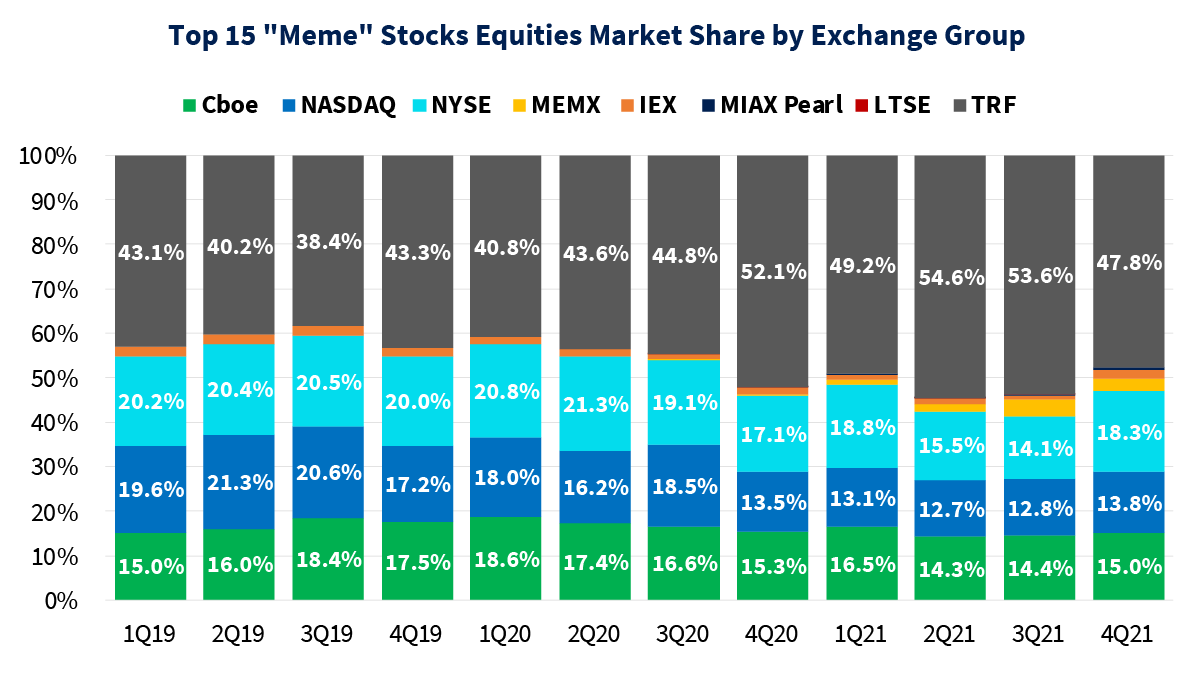
The charts below show the breakdown of exchange market share for trading meme stocks in U.S. equities and options markets. In both cases, Cboe’s exchanges show consistent market share across equities and options. In equities, Cboe’s EDGX captured considerable market share in these stocks, likely due to its innovative Retail Priority program, which provides retail attested clients execution priority at the same price over other orders. However, most of the activity in these stocks appears to occur off exchange in the Trade Reporting Facility (TRF).
Figure 3 – Equities Market Share by Exchange Group
Figure 4 – Options Market Share by Exchange Group
Data Source: OCC, Cboe, Reddit.
When breaking down the equities TRF market share, most of the off-exchange volume comes from the principal dealers, with a majority coming from brokers that cater to retail investors. This corresponds with the influx of retail trading and the beginning of the meme stock trading phenomenon at the end of 2019.
Figure 5 – ATS vs Principal Dealer Market Share
Data Source: FINRA, Reddit.
One of the persistent questions around meme stocks is what happens to a stock when it becomes a meme. The tables below illustrate the changes in stock price and volume when a stock first appears on the meme list and how persistent those changes are over time.
The table below shows when a stock first appears in the top 15 mentions (t1) and compares the volume traded on that day to the prior day (t0). We then compared the change in volume to the subsequent 45 trading days after the stock became a meme stock (t45).
Both equities and options see a significant increase in volume on day one (t1) but the increase is short-lived. Volume declines notably by day three (t3) and any gains are completely gone by day 14 (t14) through day 45 (t45) for both equities and options. However, there are a few stocks that run against the median and maintain their increased volume activity.
Figure 6 – Change in Equities Volume Table
Figure 7 – Change in Options Volume Table
Data Source: SIP, OCC, Reddit.
The median price move is below 1%, despite the increase in trading activity. Unlike the change in volume that is gone after a few days, the increase in prices appears to persist.
Figure 8 – Change in Equities Price Table
Data Source: SIP, Reddit.
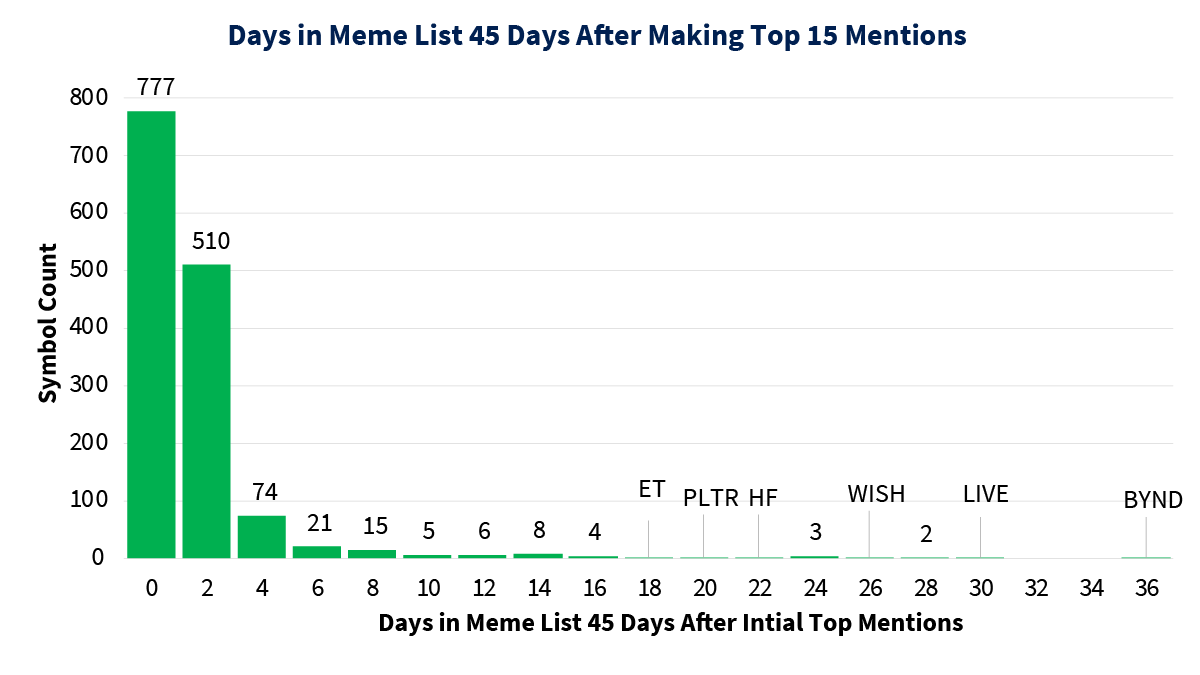
The chart below highlights the fleeting trading activity for most of the meme stocks and shows how many days that a stock continues to appear in the top 15 after its first day in the top 15 through the following 45 days (t45). As you can see, after the first few days, many of the stocks no longer appear in the top 15 and after a few weeks, only a handful of stocks sustain the momentum required to remain in the top 15 mentions.
Figure 9 – Histogram of # of Days in Meme List 45 Days After Making Top 15 Mentions
Data Source: Reddit.
The charts below show average daily trade count by size, demonstrating the significant increase in retail trading activity. We analyzed all retail attested flow in the top 15 meme stocks on Cboe’s four equities exchanges (BZX, BYX, EDGX and EDGA) by executed trade size and found that the number of trades executed with a size of 1,000 shares or less drastically increased at the start of 2020. During the meme stock phenomenon in January 2021, trades with a size between 11 and100 shares increased to almost 1 million trades per day.
Similarly for options, we analyzed all customer volume in the top 15 meme stocks on Cboe’s four options exchanges (Cboe Options, Cboe C2, EDGX and BZX) by the original order size. We used customer designated volume as a proxy for retail, as the market lacks a precise way to distinguish between retail and non-retail volume in the options market. While customer volume represents a significant amount of retail trading activity, the presence of institutional trading activity should also be considered. Similar to equities, the introduction of zero-commission trading ushered in increased options volumes toward the end of 2019, most notably in trades with an order size between 1 and 10. In January 2021, trades with an order size between 1 and 10 reached more than 1 million trades per day in the top 15 meme stocks. That count continues to climb into the end of 2021.

Figure 11 – Options Avg. Daily Trade Count by Order Size
Data Source: Cboe, Reddit.
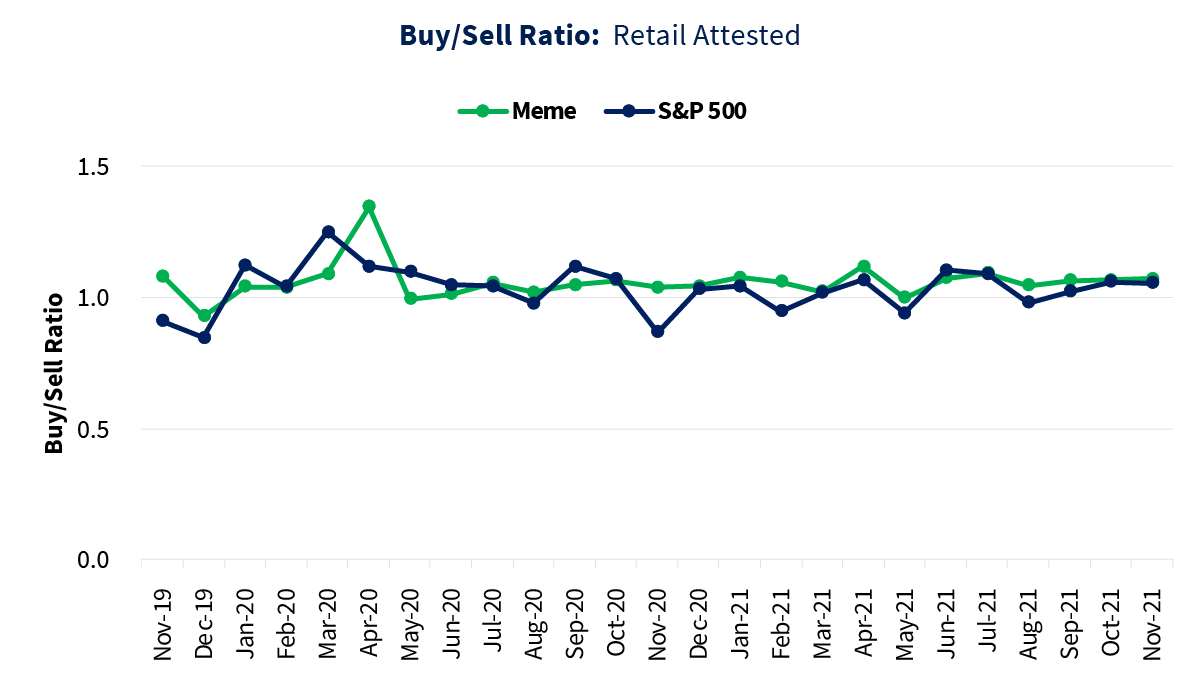
A large portion of retail trading volume is considered day trading activity. We analyzed this on Cboe’s exchanges using the same proxy for retail in the data. We examined the ratio of buy-to-sell in retail attested orders in the top 15 meme names, then compared it to the S&P 500 Index to highlight some of this activity on Cboe’s U.S. equities exchanges. In equities, the buy-to-sell ratio in meme stocks spiked to 1.4 in April 2020, before coming down and remaining steady at about 1. On Cboe’s options exchanges, we looked at the ratio between the number of opened contracts versus closed contracts in customer volume to highlight a similar point. For meme stocks, the open-to-close ratio decreased closer to 1, illustrating that more retail customers are day trading these stocks and not holding onto them for an extended period of time.
Figure 12 – Buy to Sell Ratio
Figure 13 – Open to Close Ratio
Data Source: Cboe, Reddit.
Looking at the percentage of options from the OCC by clearing type shows how much of an impact retail volume had on the options markets in the first few months of 2021. Historically, customer volume has always been less than market maker volume. However, customer volume surpassed market maker volume in the top 15 meme stocks from January to March 2021, the most volatile months of the meme stock trading phenomenon. This unusual increase in volume is a result of customer volume pairing off one another.
Figure 14 – Percentage of Volume by Clearing Type
Data Source: OCC, Reddit.
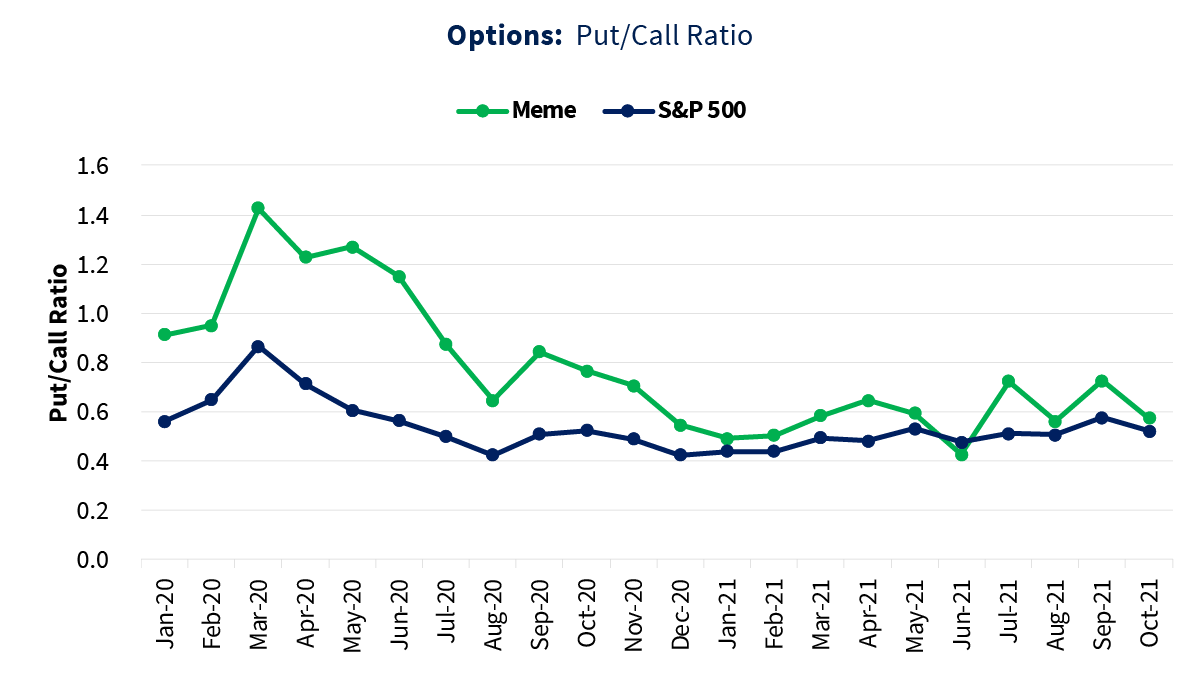
The put/call ratio is widely used by investors to gauge the overall mood of the market. According to Cboe Data Shop, the average put/call ratio of 0.7 is considered a “healthy” market, as normally investors buy more calls than puts. Both meme stocks and those in the S&P 500 Index saw a large uptick at the beginning of the COVID-19 pandemic but the put/call ratio eventually decreased and the S&P 500 Index has stabilized since December 2020. For meme stocks however, the put/call ratio has remained volatile in recent months and higher than the same ratio for the S&P 500 Index.
Figure 15 – Put Call Ratio Monthly Trend
Data Source: Cboe DataShop, Reddit.
We also measured the change in the put/call ratio after a meme stock makes the top 15. On the initial day that a stock enters the list (t1), on average, its put/call ratio decreases by 0.2, demonstrating that investors buy more calls than puts once the name is one of the top mentions. However, the put/call ratio then increases in the days and weeks following the stock’s entrance into the top 15.
Figure 16 – Put Call Ratio Table
Data Source: OCC, Reddit.
Additionally, we studied what happens to total open interest and customer volume when a meme stock enters the top 15 . On the initial day the stock enters the top 15 list (t1), the median increase in total open interest is 3% and it continues to increase the following days and weeks, indicating new or additional money coming into the market. Interestingly, on day one (t1), customer volume has a median increase of about 23%, then decreases about two weeks later, and continues to decline after 45 trading days.
Figure 17 – Open Interest Table
Figure 18 – Customer Volume Table
Data Source: OCC, Reddit.
We leveraged the Data Shop High Level Options Sentiment dataset to study the quantitative and qualitative order flow analysis for every underlying options symbol. The charts below show 20-day realized volatility and average 30-day 25 Delta Skew for the top 15 meme stocks and the S&P 500 Index.
Unsurprisingly, there is a large uptick in 20-day realized volatility at the start of the pandemic for meme stocks and S&P 500 Index stocks. Following this period of increased volatility, the S&P 500 Index decreased and volatility in these stocks remained relatively low compared to meme stocks. There were two additional large spikes in meme stock volatility, first during the January 2021 trading phenomenon and again in May 2021 when meme stock volume began to pick up again.
We also studied 25 Delta Skew, which indicates the demand for downside versus upside potential in options, commonly used to monitor directional sentiment. There was a large spike in 25 Delta Skew at the peak of the pandemic in both meme stocks and S&P 500 Index stocks; however, it has come down substantially since. This flattening of skew over the past two years indicates that traders are more focused on upside potential, especially in meme stocks. With the 25 Delta Skew for meme stocks moving into negative territory in more volatile months.
Figure 19 – 20 Day Realized Volatility
Figure 20 – Avg. 30 Day 25 Delta Skew (Normalized)
Data Source: Cboe DataShop, Reddit.
While meme stocks are not the force they were in early 2021, our studies show that they continue to play a crucial role in both the U.S. equities and options markets. Retail traders and the use of online discussion boards have a meaningful impact on price and volume when a stock begins to gain momentum among these investors. Cboe’s wide range of products in all asset classes, including EDGX Retail Priority and the various data products available in Cboe’s Data Shop enable customers to make informed decisions on how to access this liquidity and study trends in the market. Please reach out to Cboe’s North American equities coverage team with questions and to learn more about how we can help optimize your trading experience.
There are important risks associated with transacting in any of the Cboe Company products discussed here. Before engaging in any transactions in those products, it is important for market participants to carefully review the disclosures and disclaimers contained at https://www.cboe.com/options_futures_disclaimers